Wave disturbance study for the Fanes fishing port reconstruction
The wave disturbance study is part of the project entitled "Complementary studies and detailed design of Fanes fishing port", assigned to CNWAY in June 2015.
Project scope
Wave disturbance analysis serves as a decision making tool which enables port layout optimization through the assessment of berthing conditions. The scope of the study is to investigate wave conditions in the alternative port layouts (as set out in the port development framework), assess how they compares with the existing conditions and assert that the proposed berthing facilities are acceptable from this standpoint.
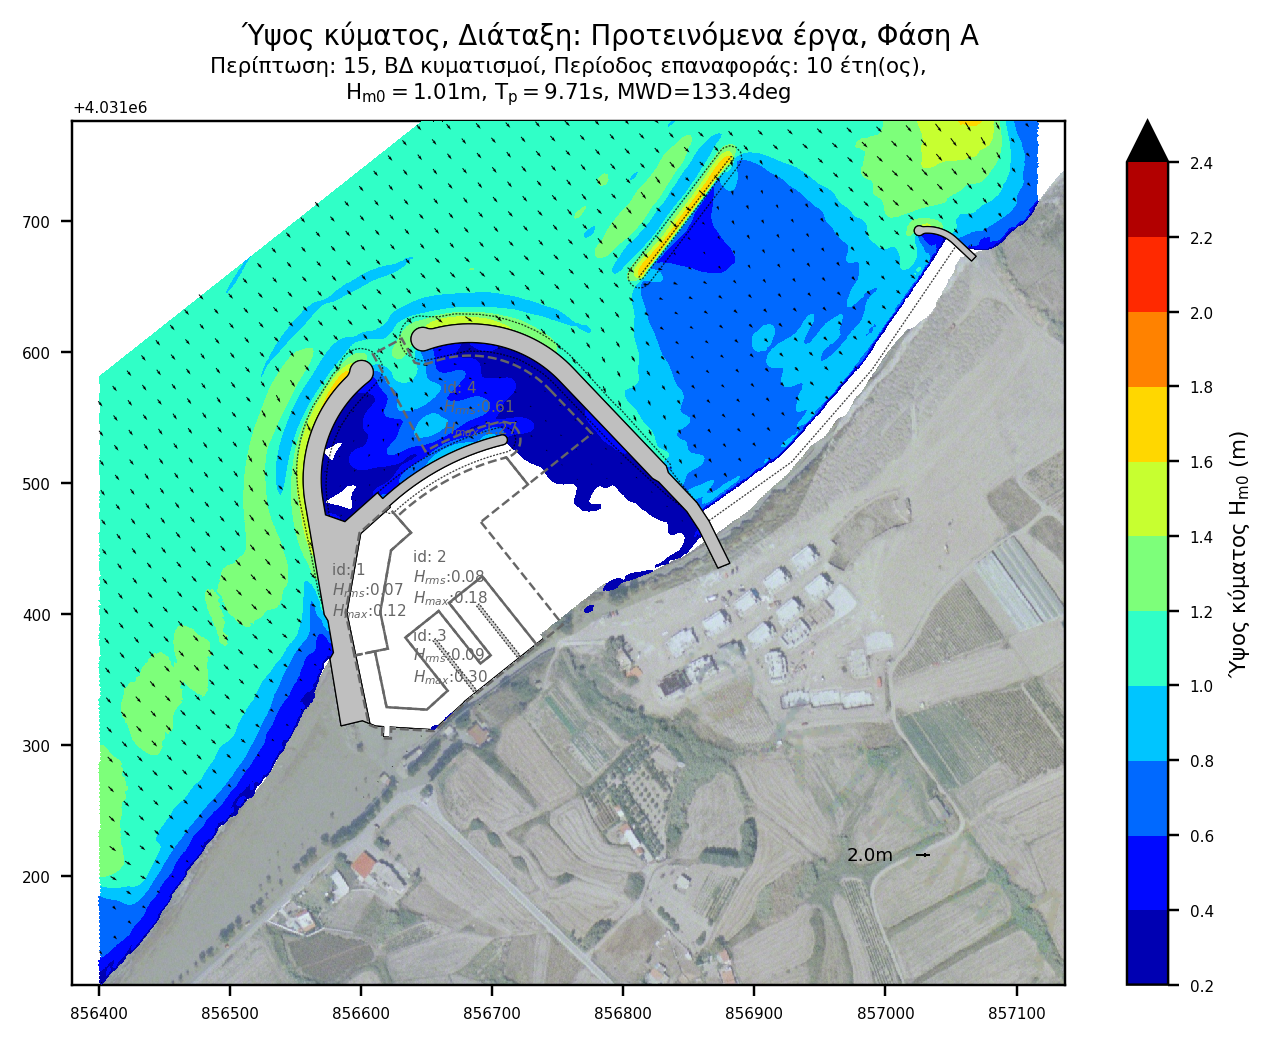
Alternative layouts
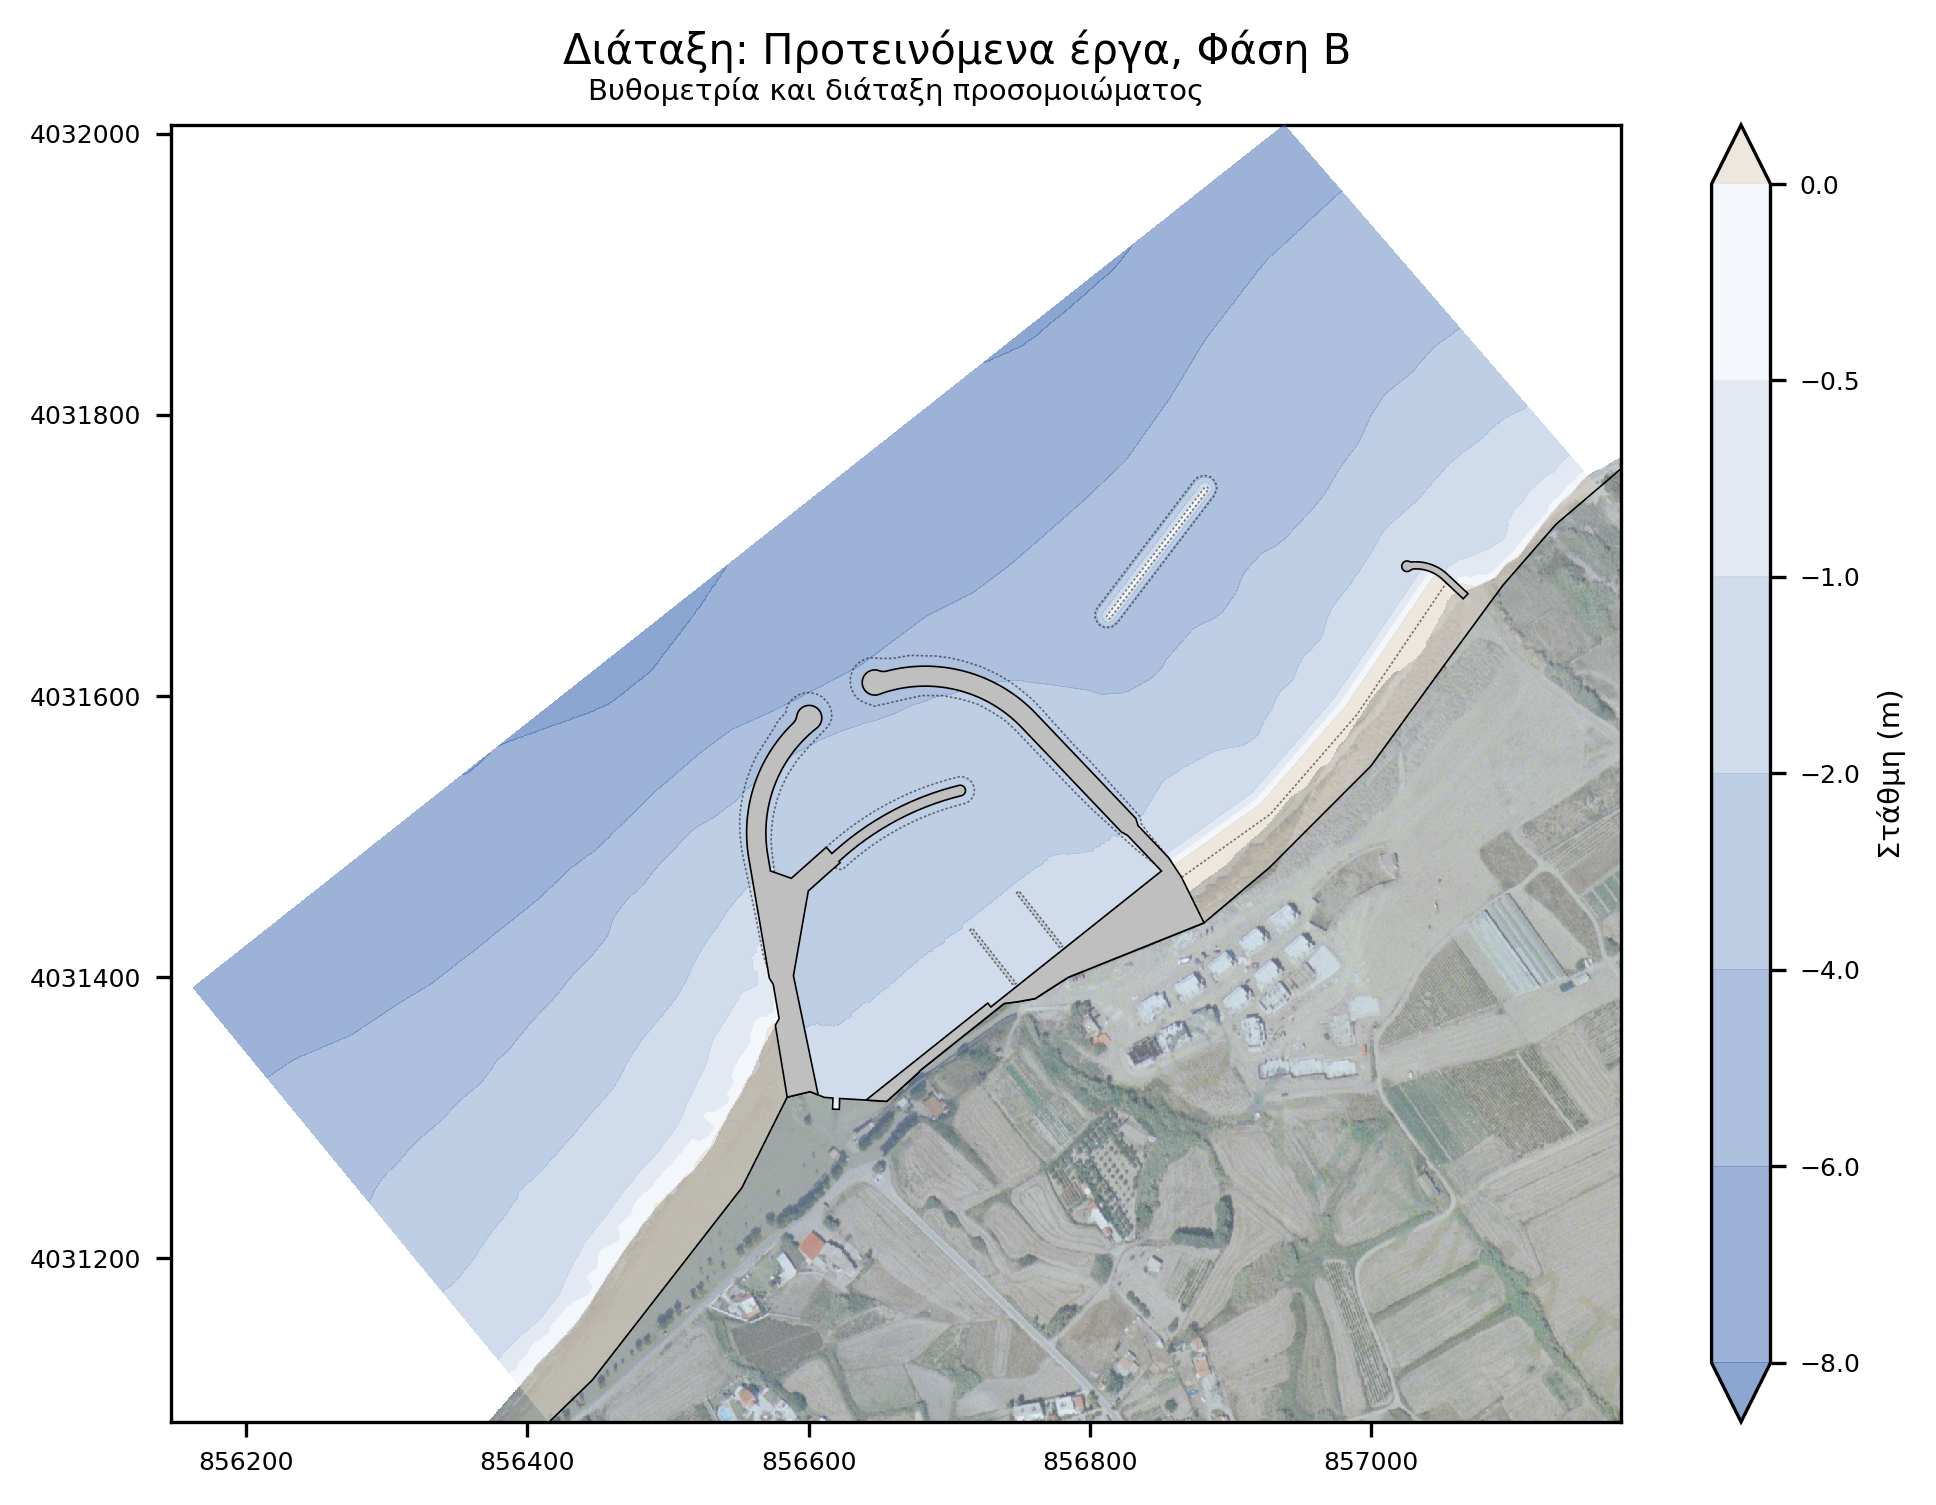
The works are proposed to be completed in 2 phases,. Phase A concerns the proposed layout, as it emerged from the results of the sediment transport study. Phase B concerns changes only in the internal layout of the works, the coastal quays, the sand bypass transport road and the relocation of the floating docks.
Therefore, in addition to the wave disturbance in the existing layout, the proposed works were examined in both phase arrangements.
Numerical modeling
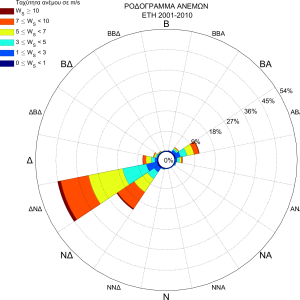
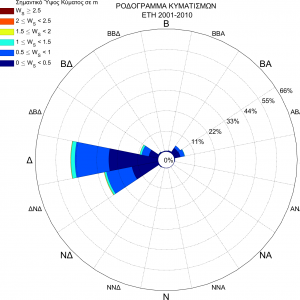
Wave climate
Wave and wind data are derived from the WAMC4 and Skiron/Eta forecast model from node 960_209 with a latitude and longitude of 36.24o, 27.57o respectively. The node is located 4,7 kilometers away from the project site. The duration of the dataset covers the period between 2001 and 2010.
Modeling characteristics
The simulation is performed by employing two separate models, the offshore and the wave disturbance model. The former extends from the location of the offshore wave conditions (the node of the WAM wave model) up to the shore, and its role is to prescribe boundary conditions to the wave disturbance model.
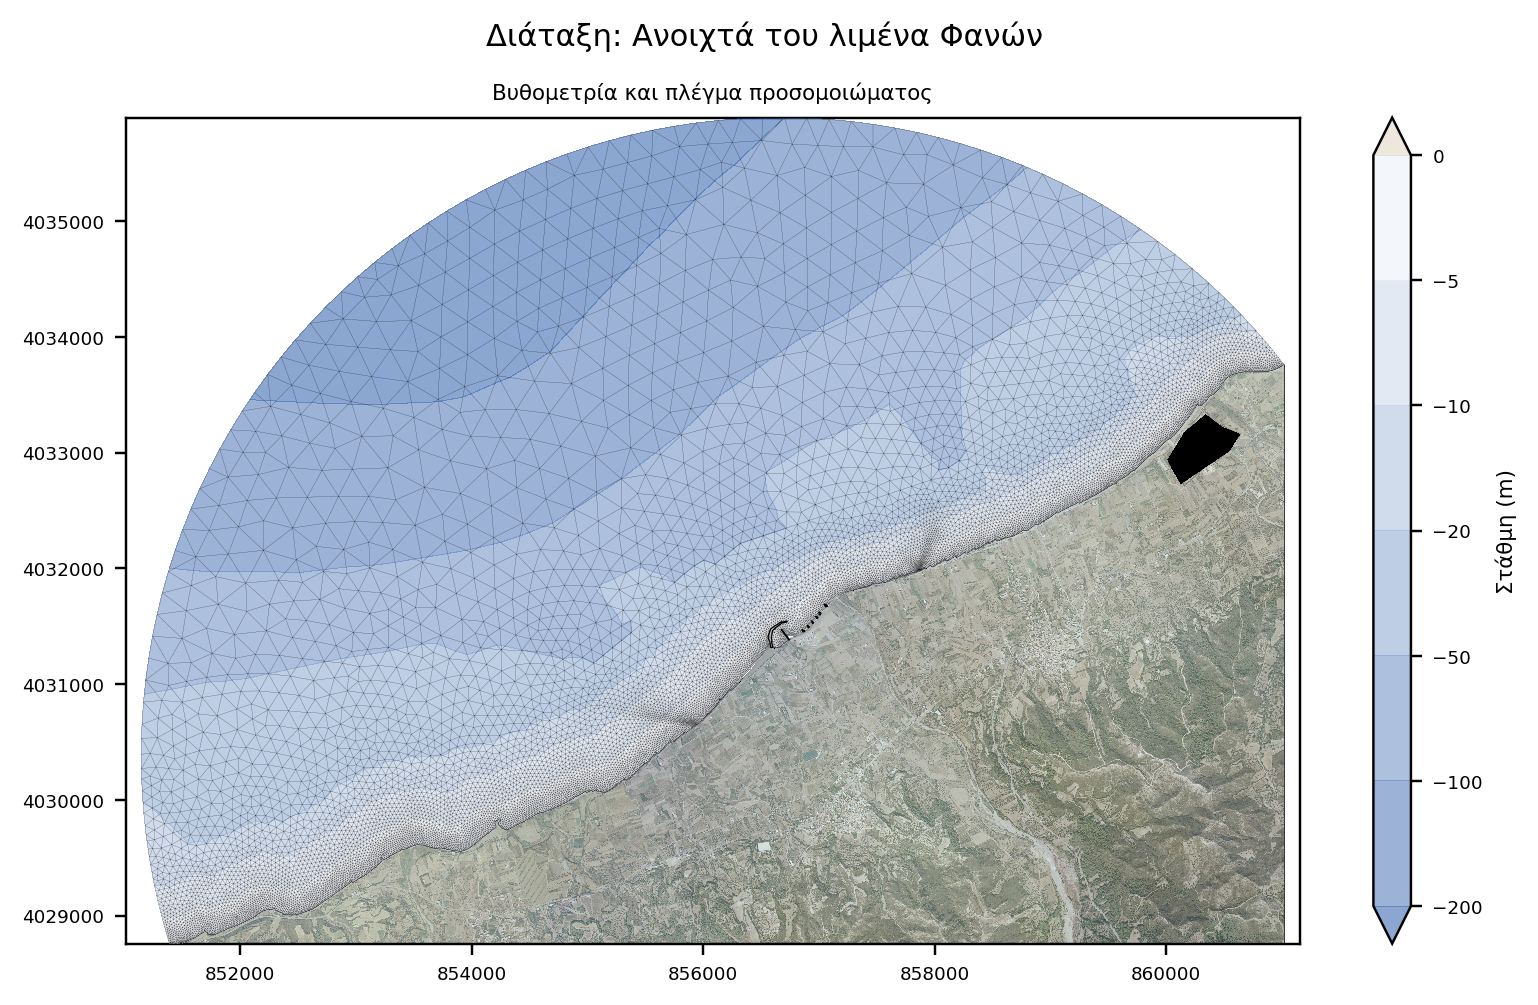


- Offshore model: It extends around the area of works at a radius of 5km covering a circular sector perimeter of 28 km. It occupies a total area of 39,4 km2 and consists of 25,000 elements and 13,000 nodes.
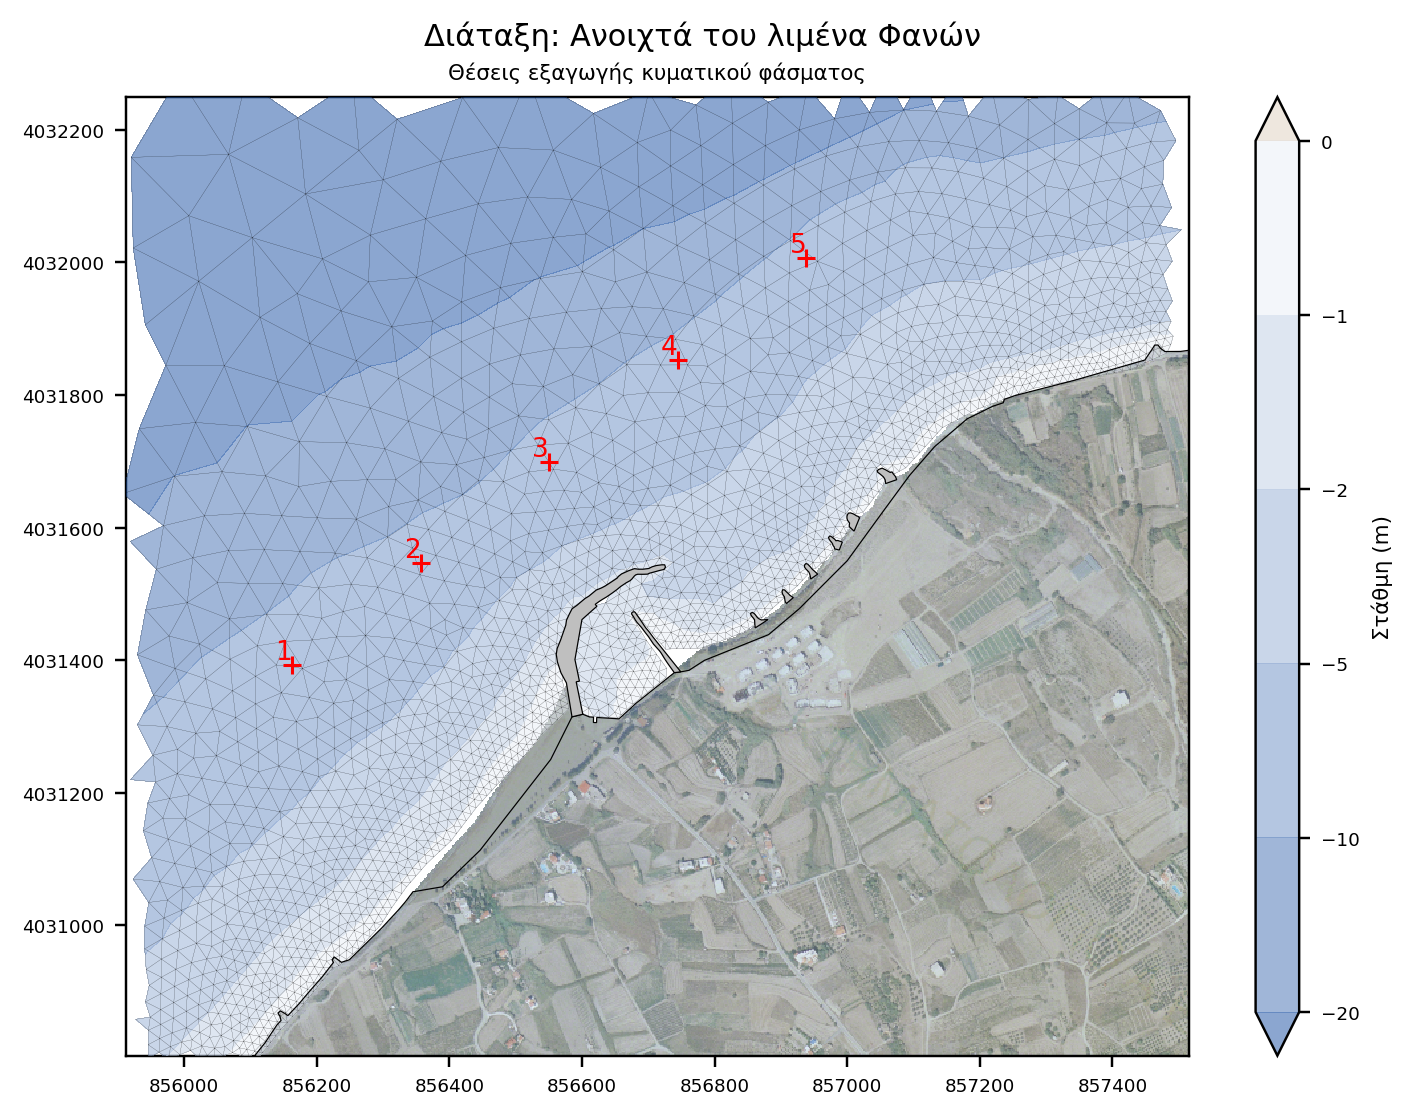
- Wave disturbance model: It extends 1000 meters along the coastline and 400 meters laterally. It covers an area of about 0.36 km2 and consists of about 194,000 elements and 98,000 nodes.
In order to prescribe the appropriate boundary conditions, extreme value analysis (EVA) was performed (for each wave direction that is applicable to the site) where parameters of interest were determined on the basis of specific return periods (10, 20 years etc.).
A total of 27 wave cases corresponding to 108 simulations were executed. They consist of:
- 27 TOMAWAC simulations to propagate wave conditions from the WAMC4 regional model node to the project location,
- 81 ARTEMIS simulations, for the calculation of wave disturbance, 27 for every wave case, 3 layouts (Existing layout, Phase A, Phase B).
Results
For further analysis and objective comparison of the results, areas of interest have been defined for every layout. For each area, the following parameters have been calculated:
- Active (Ηm0(rms)) and maximum wave height (Hm0(max)) for absolute disturbance and
- Active (Ηm0(rms),), maximum (Hm0(max)) and minimum wave height (Hm0(min)) for differential disturbance
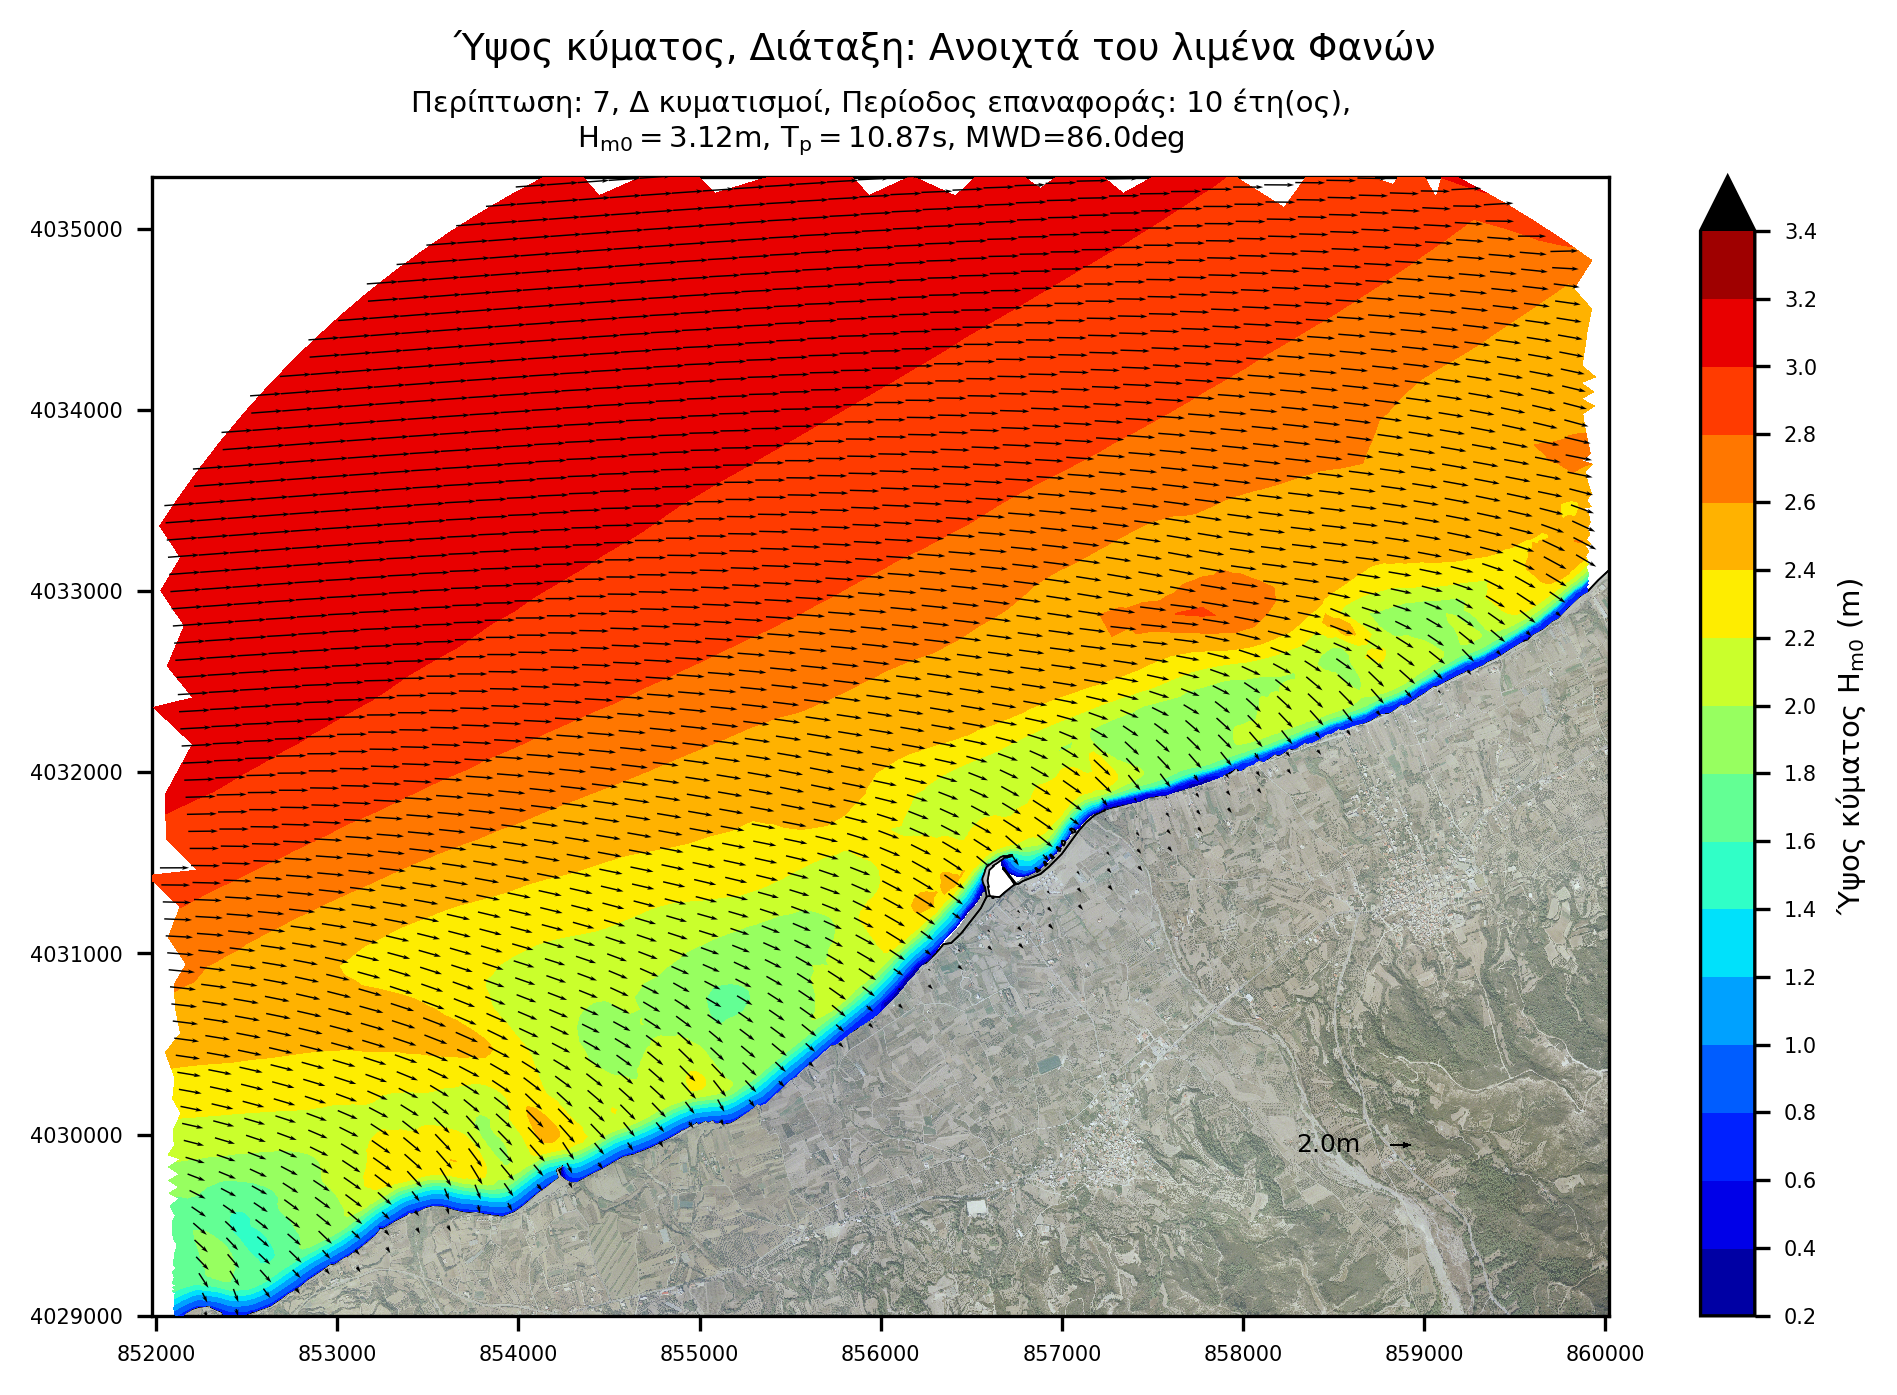
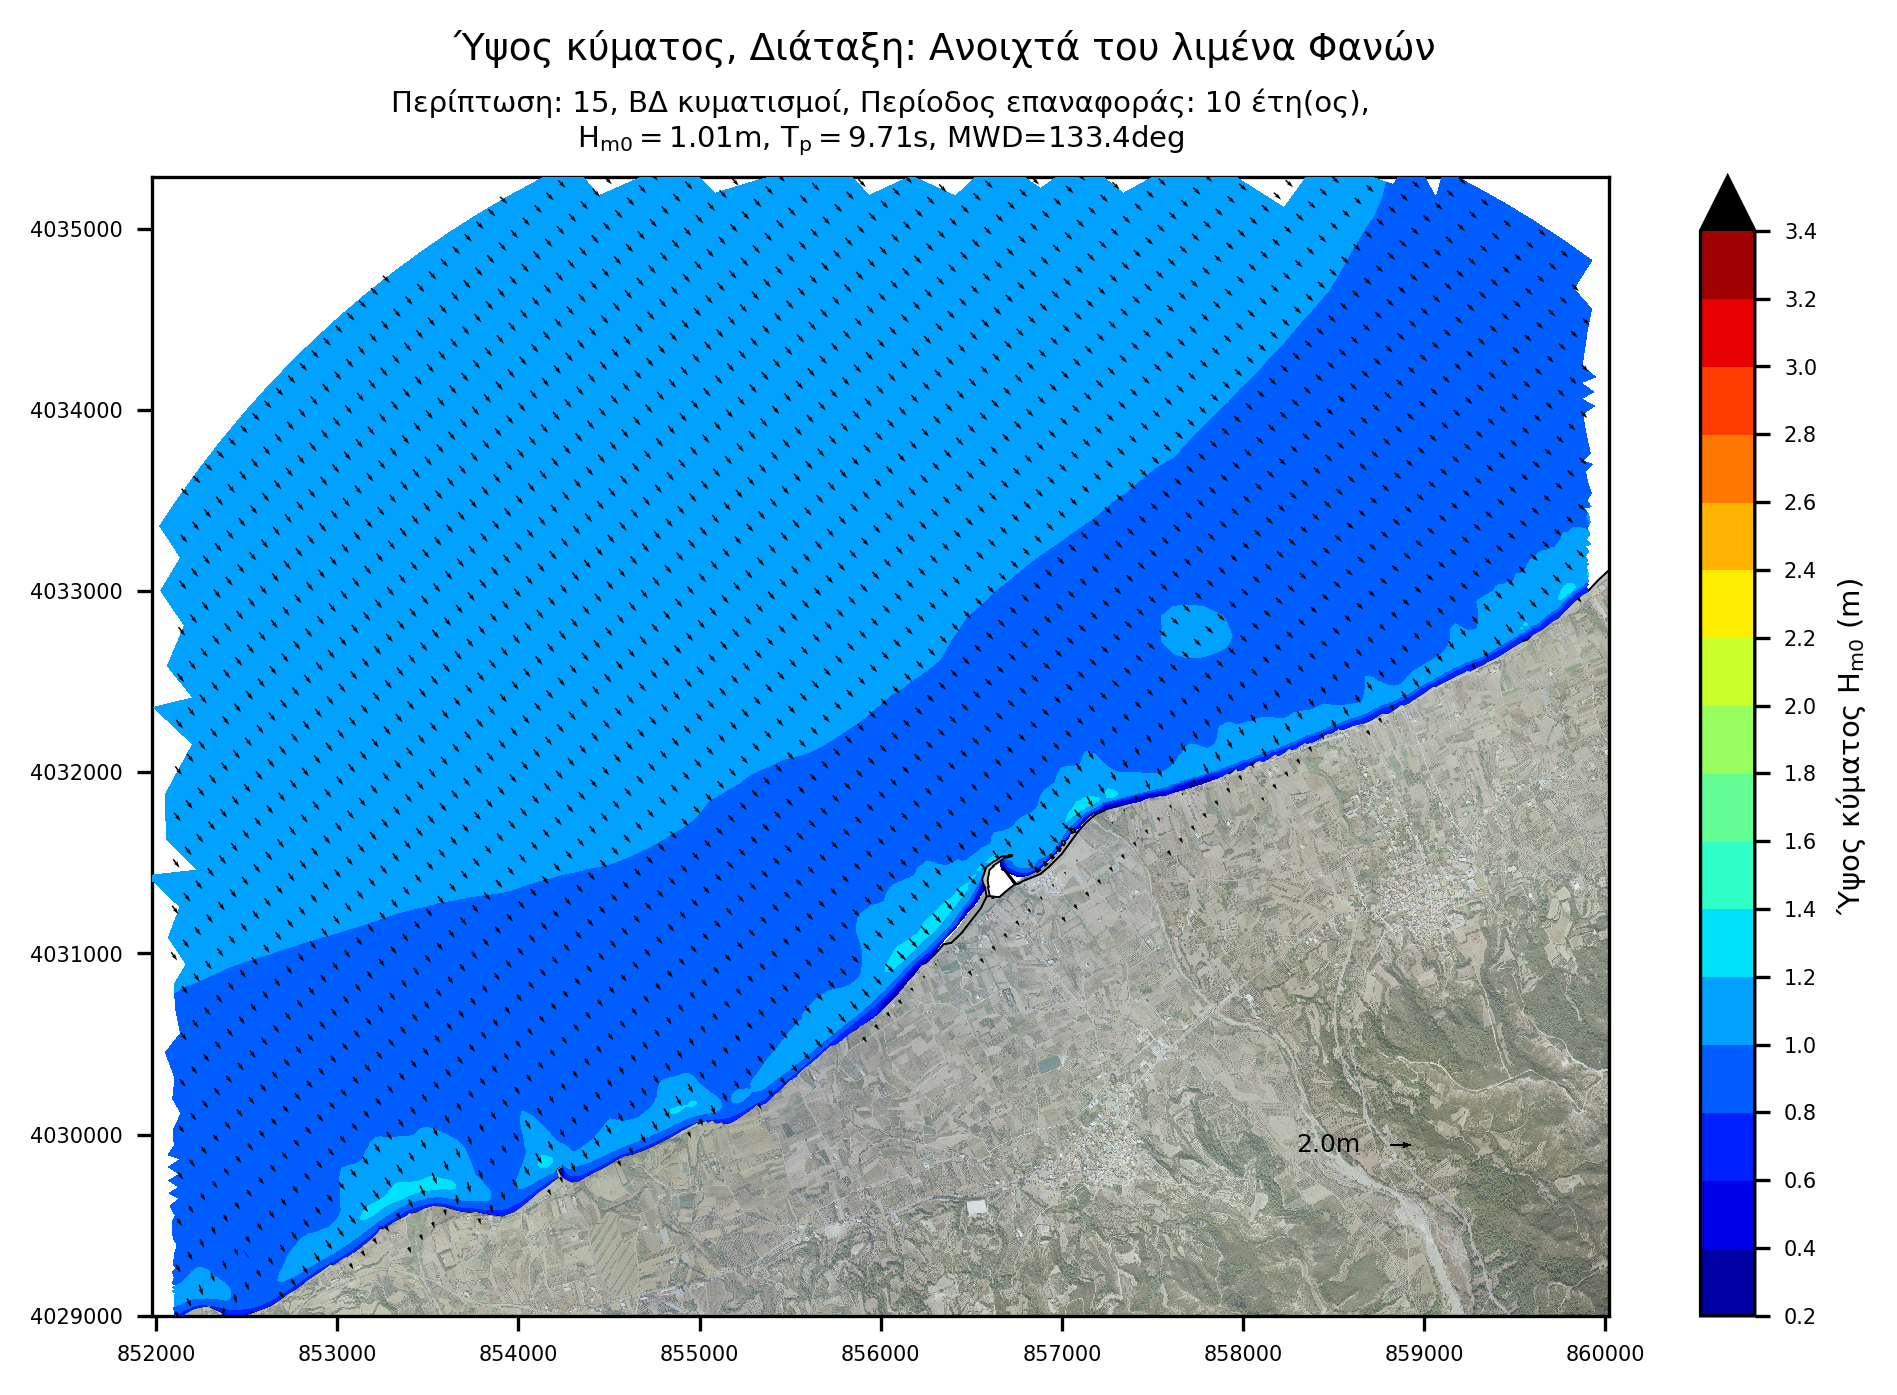
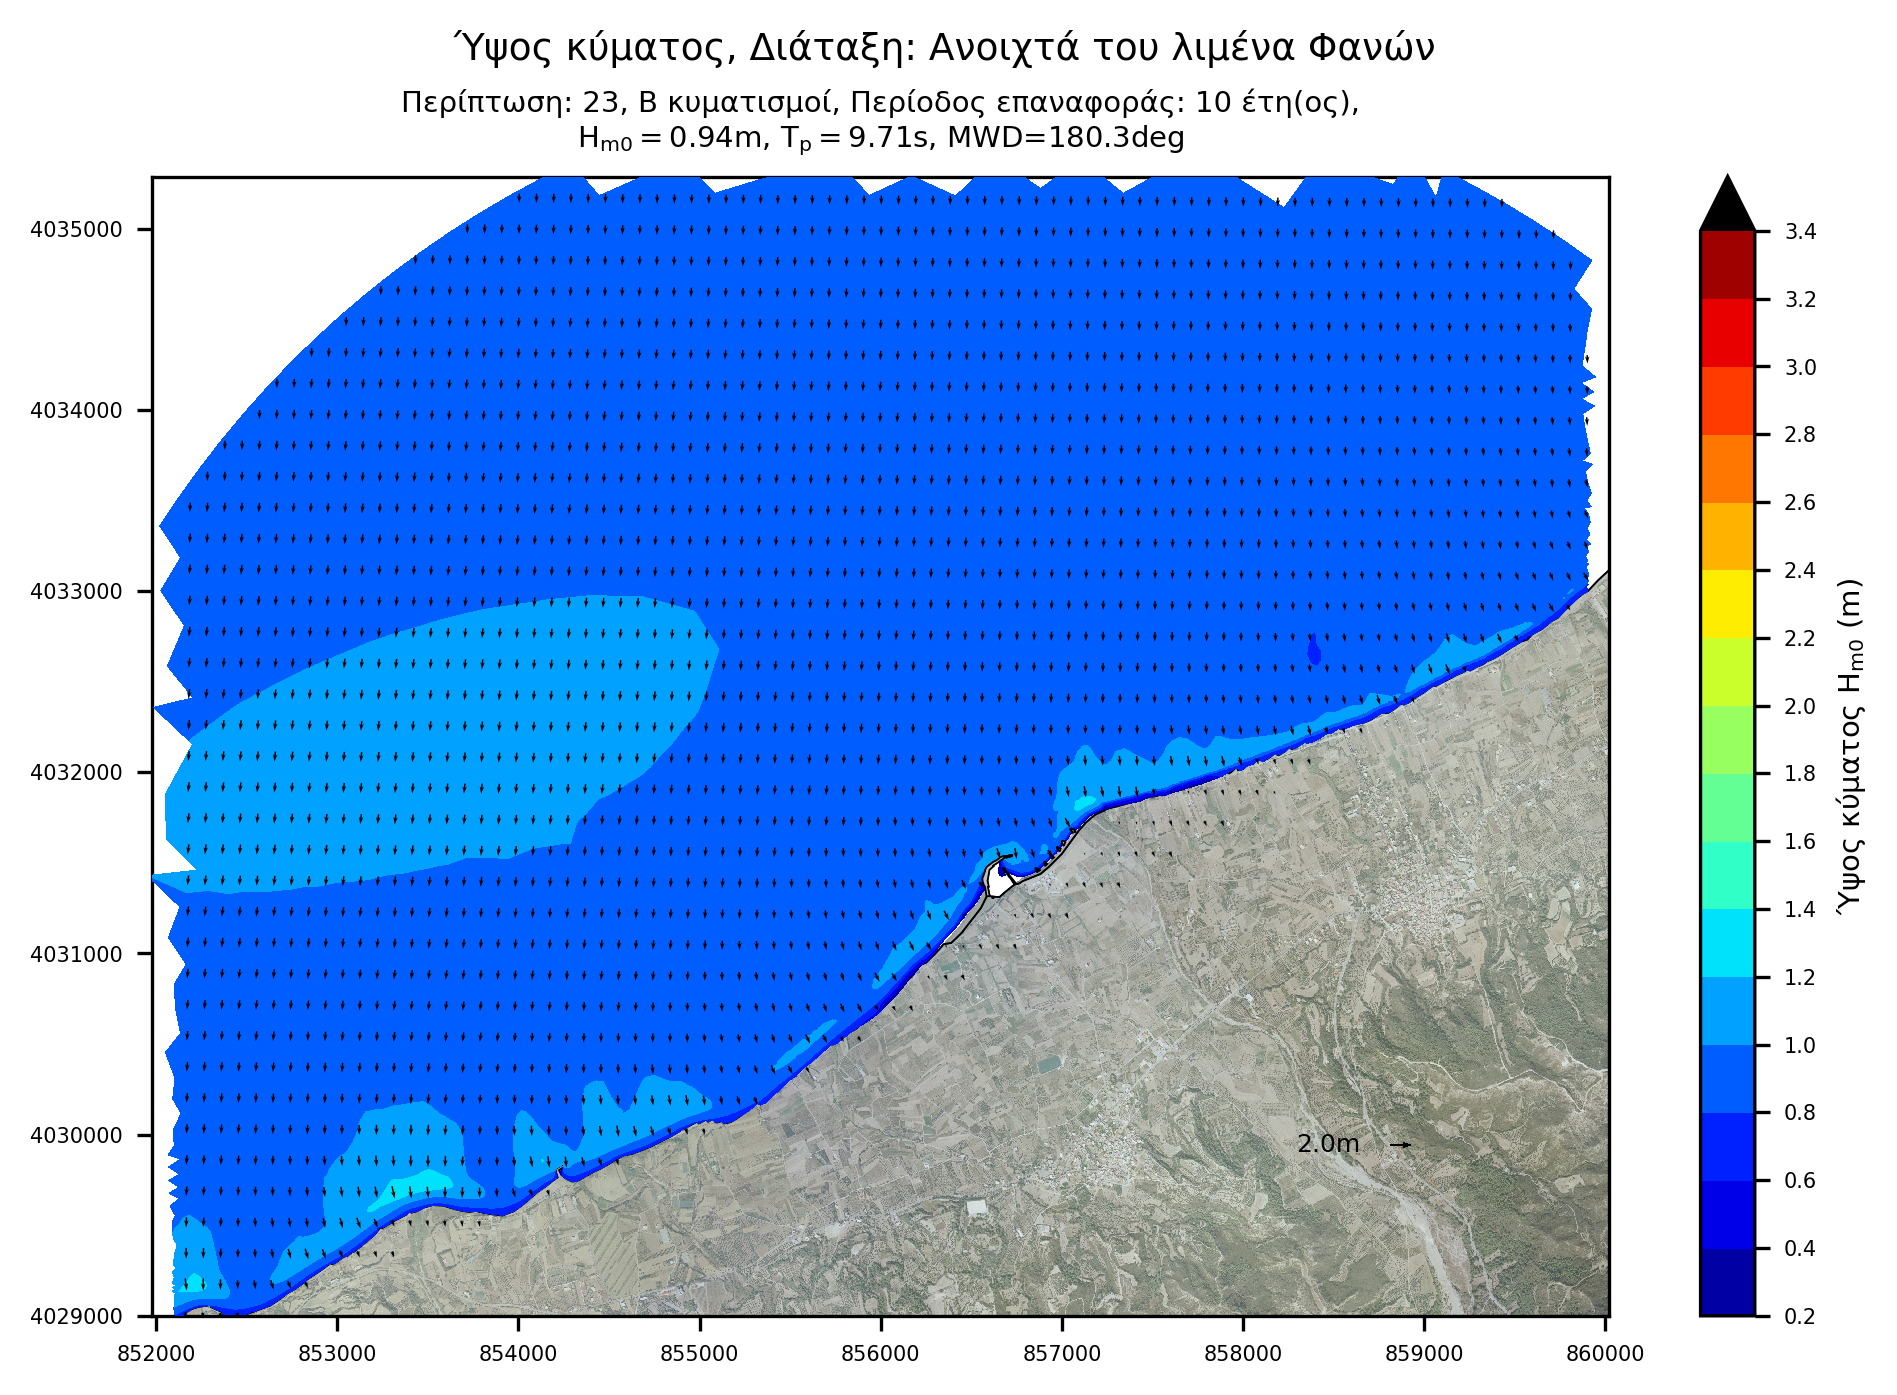
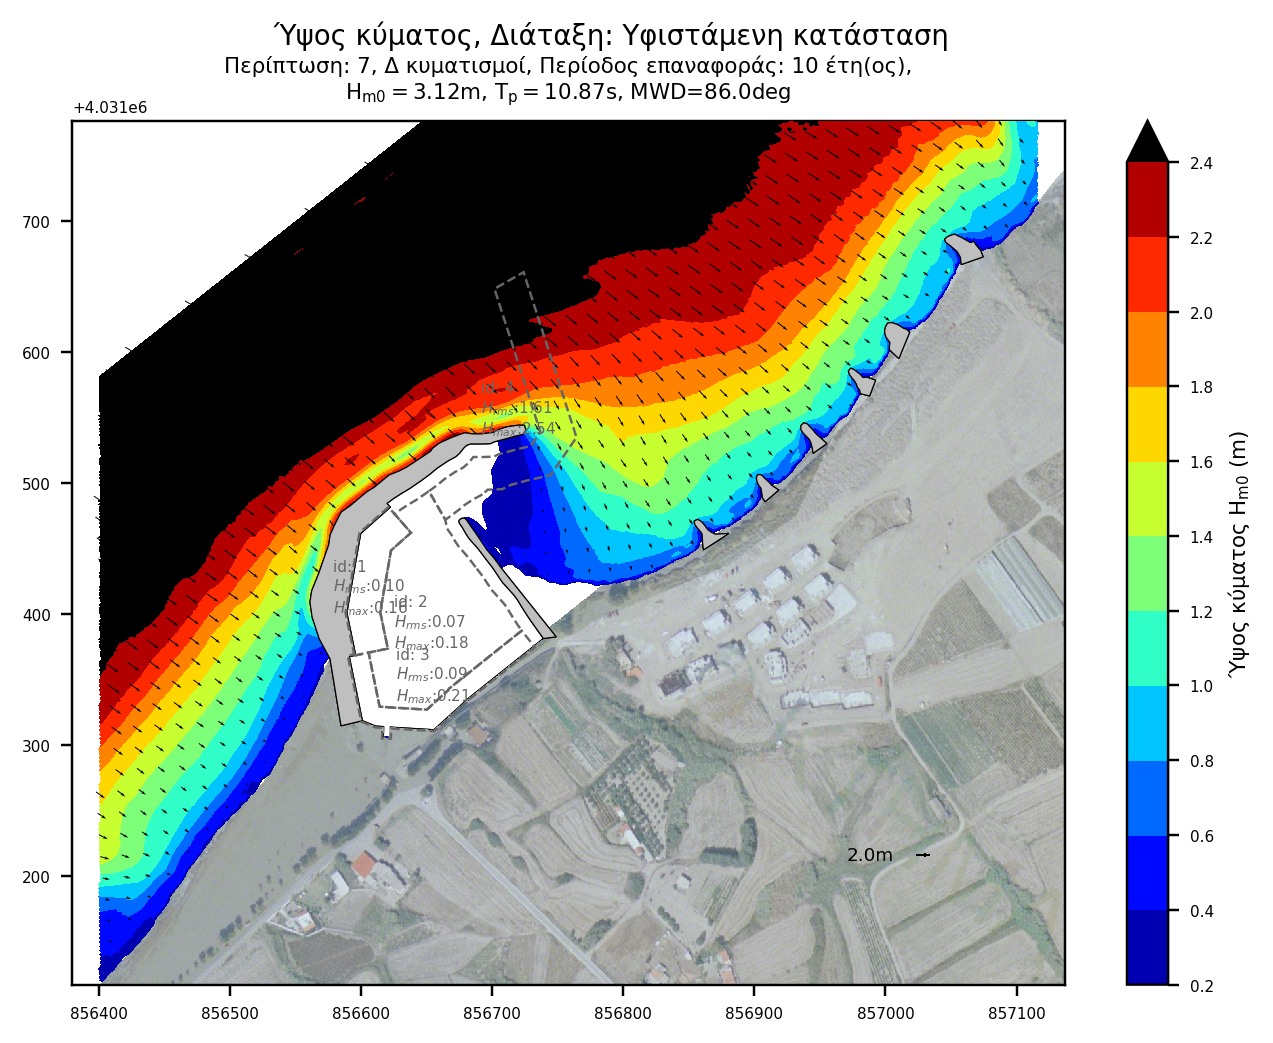
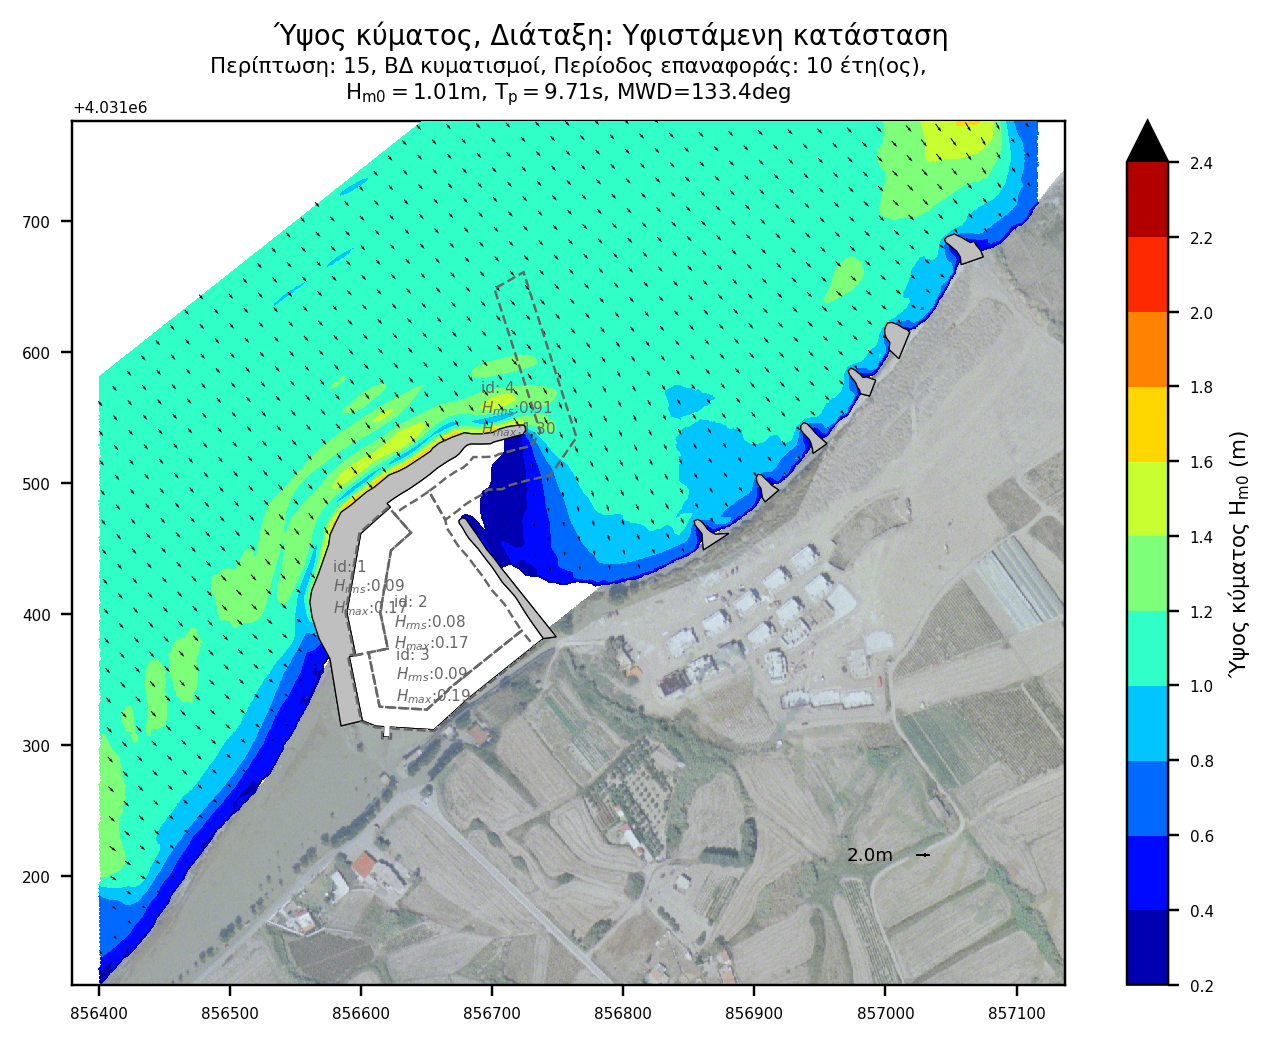
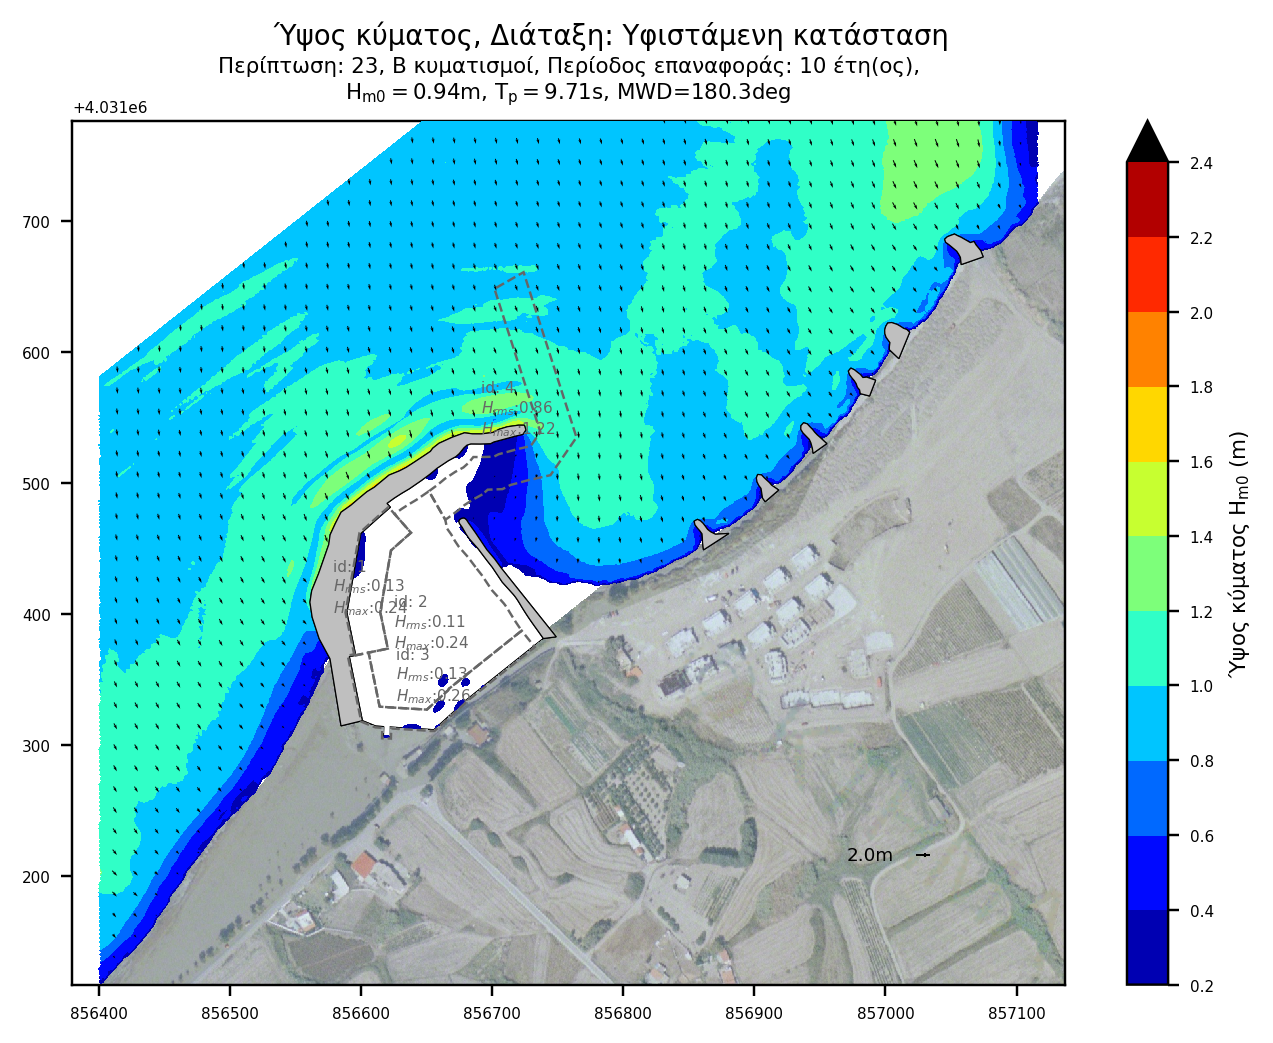
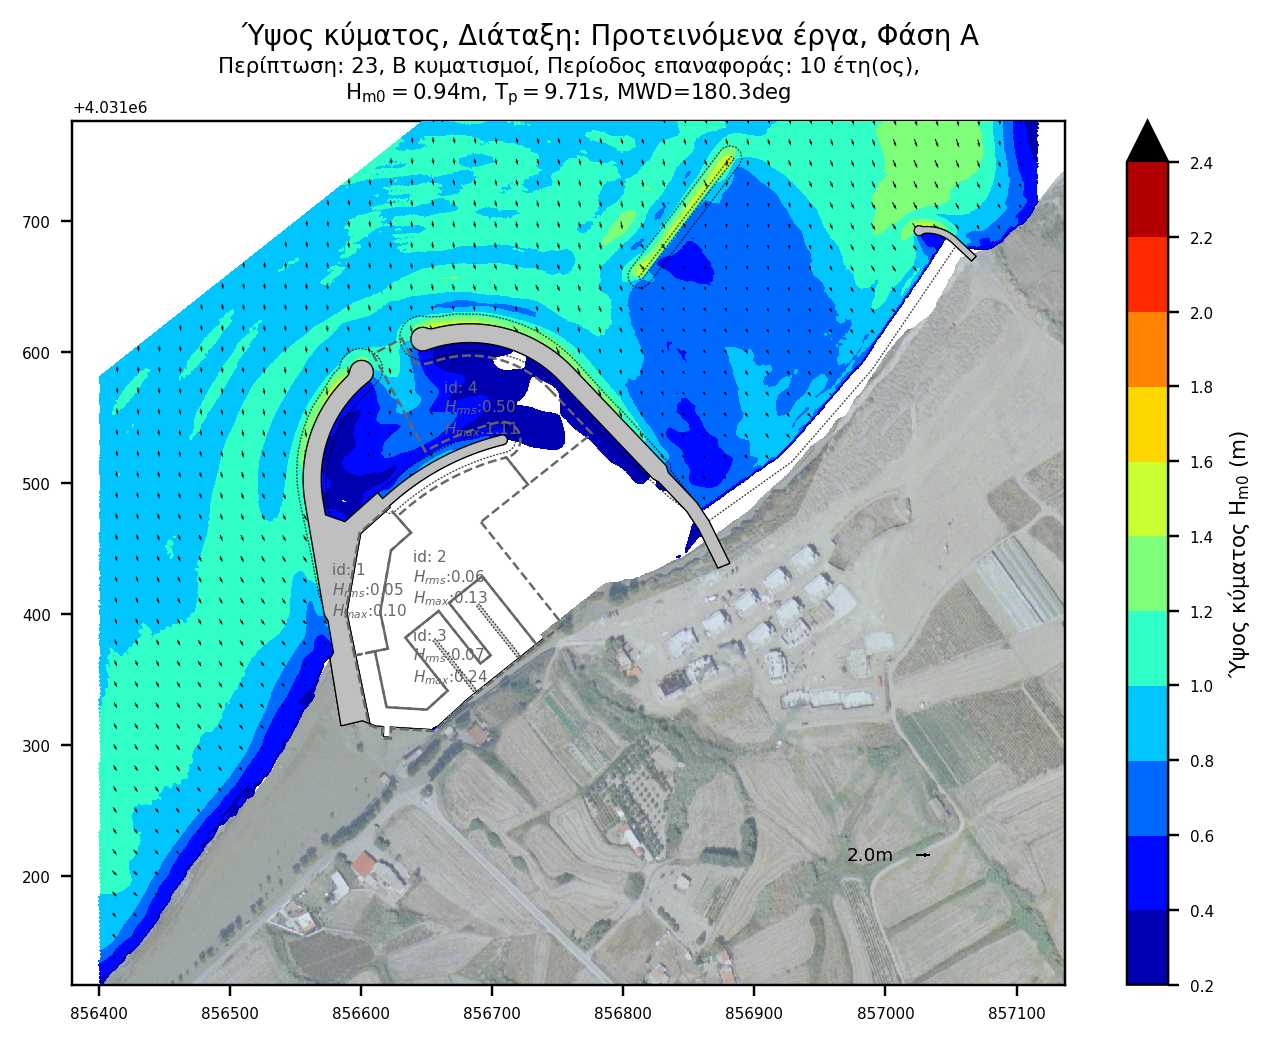
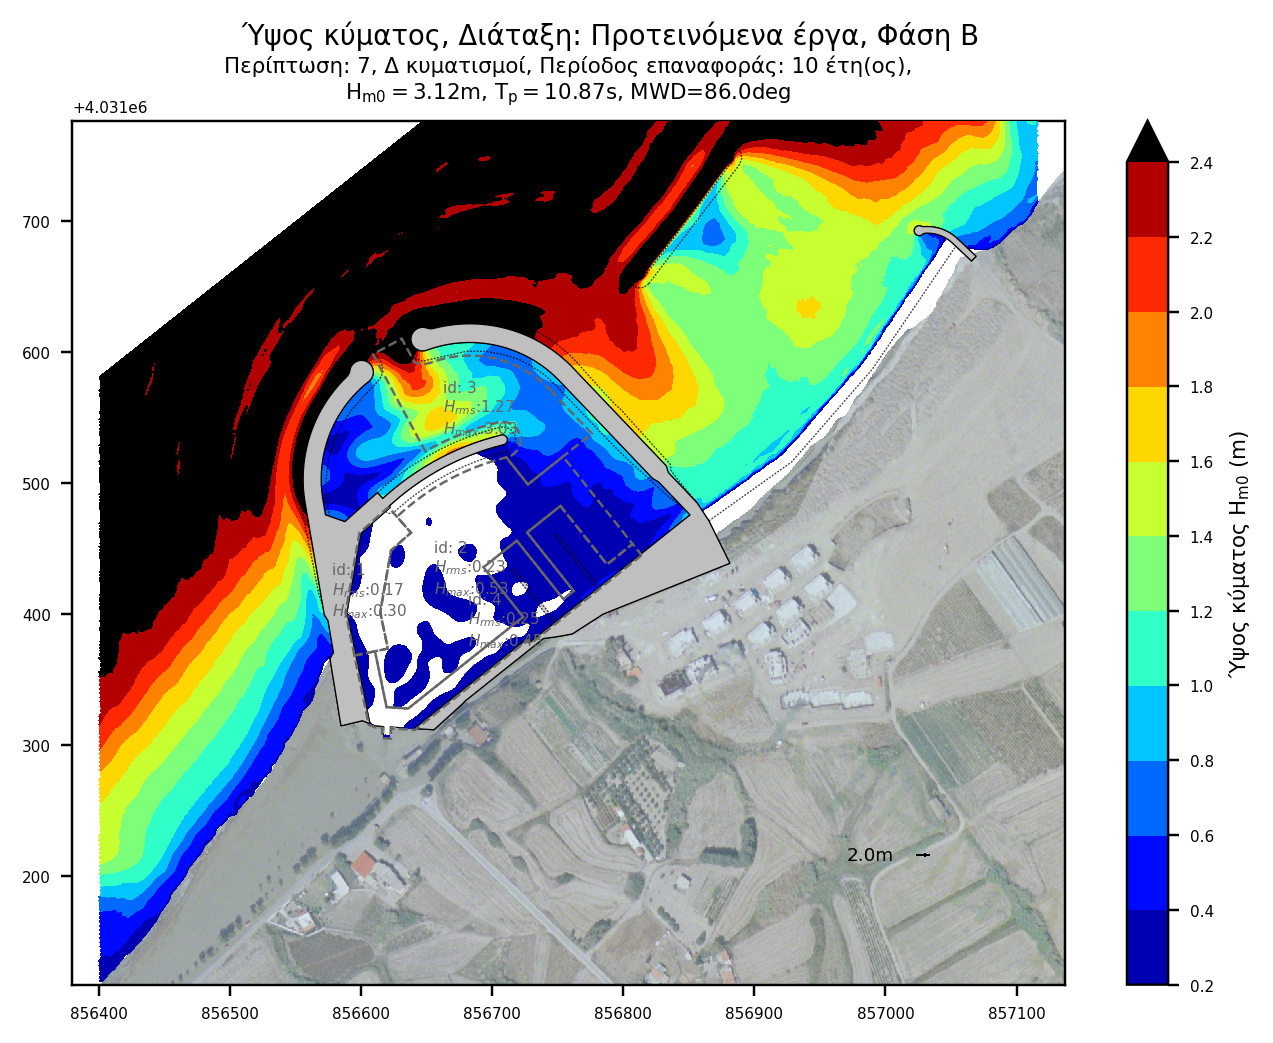
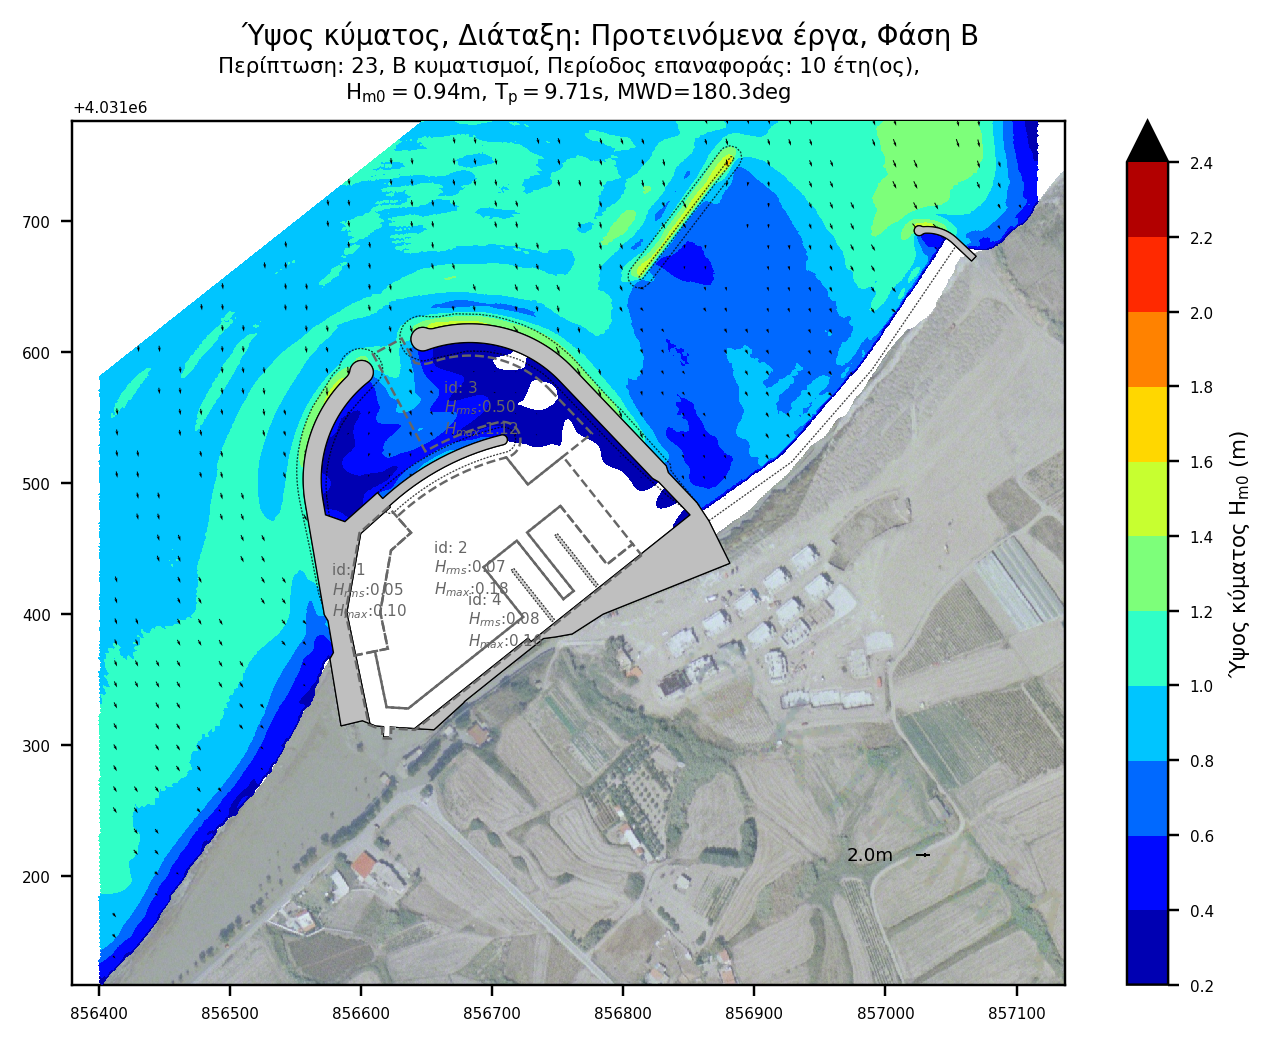
Absolute disturbance plots
Absolute wave disturbance plots show the results of each layout for each wave case, as derived from the simulation.


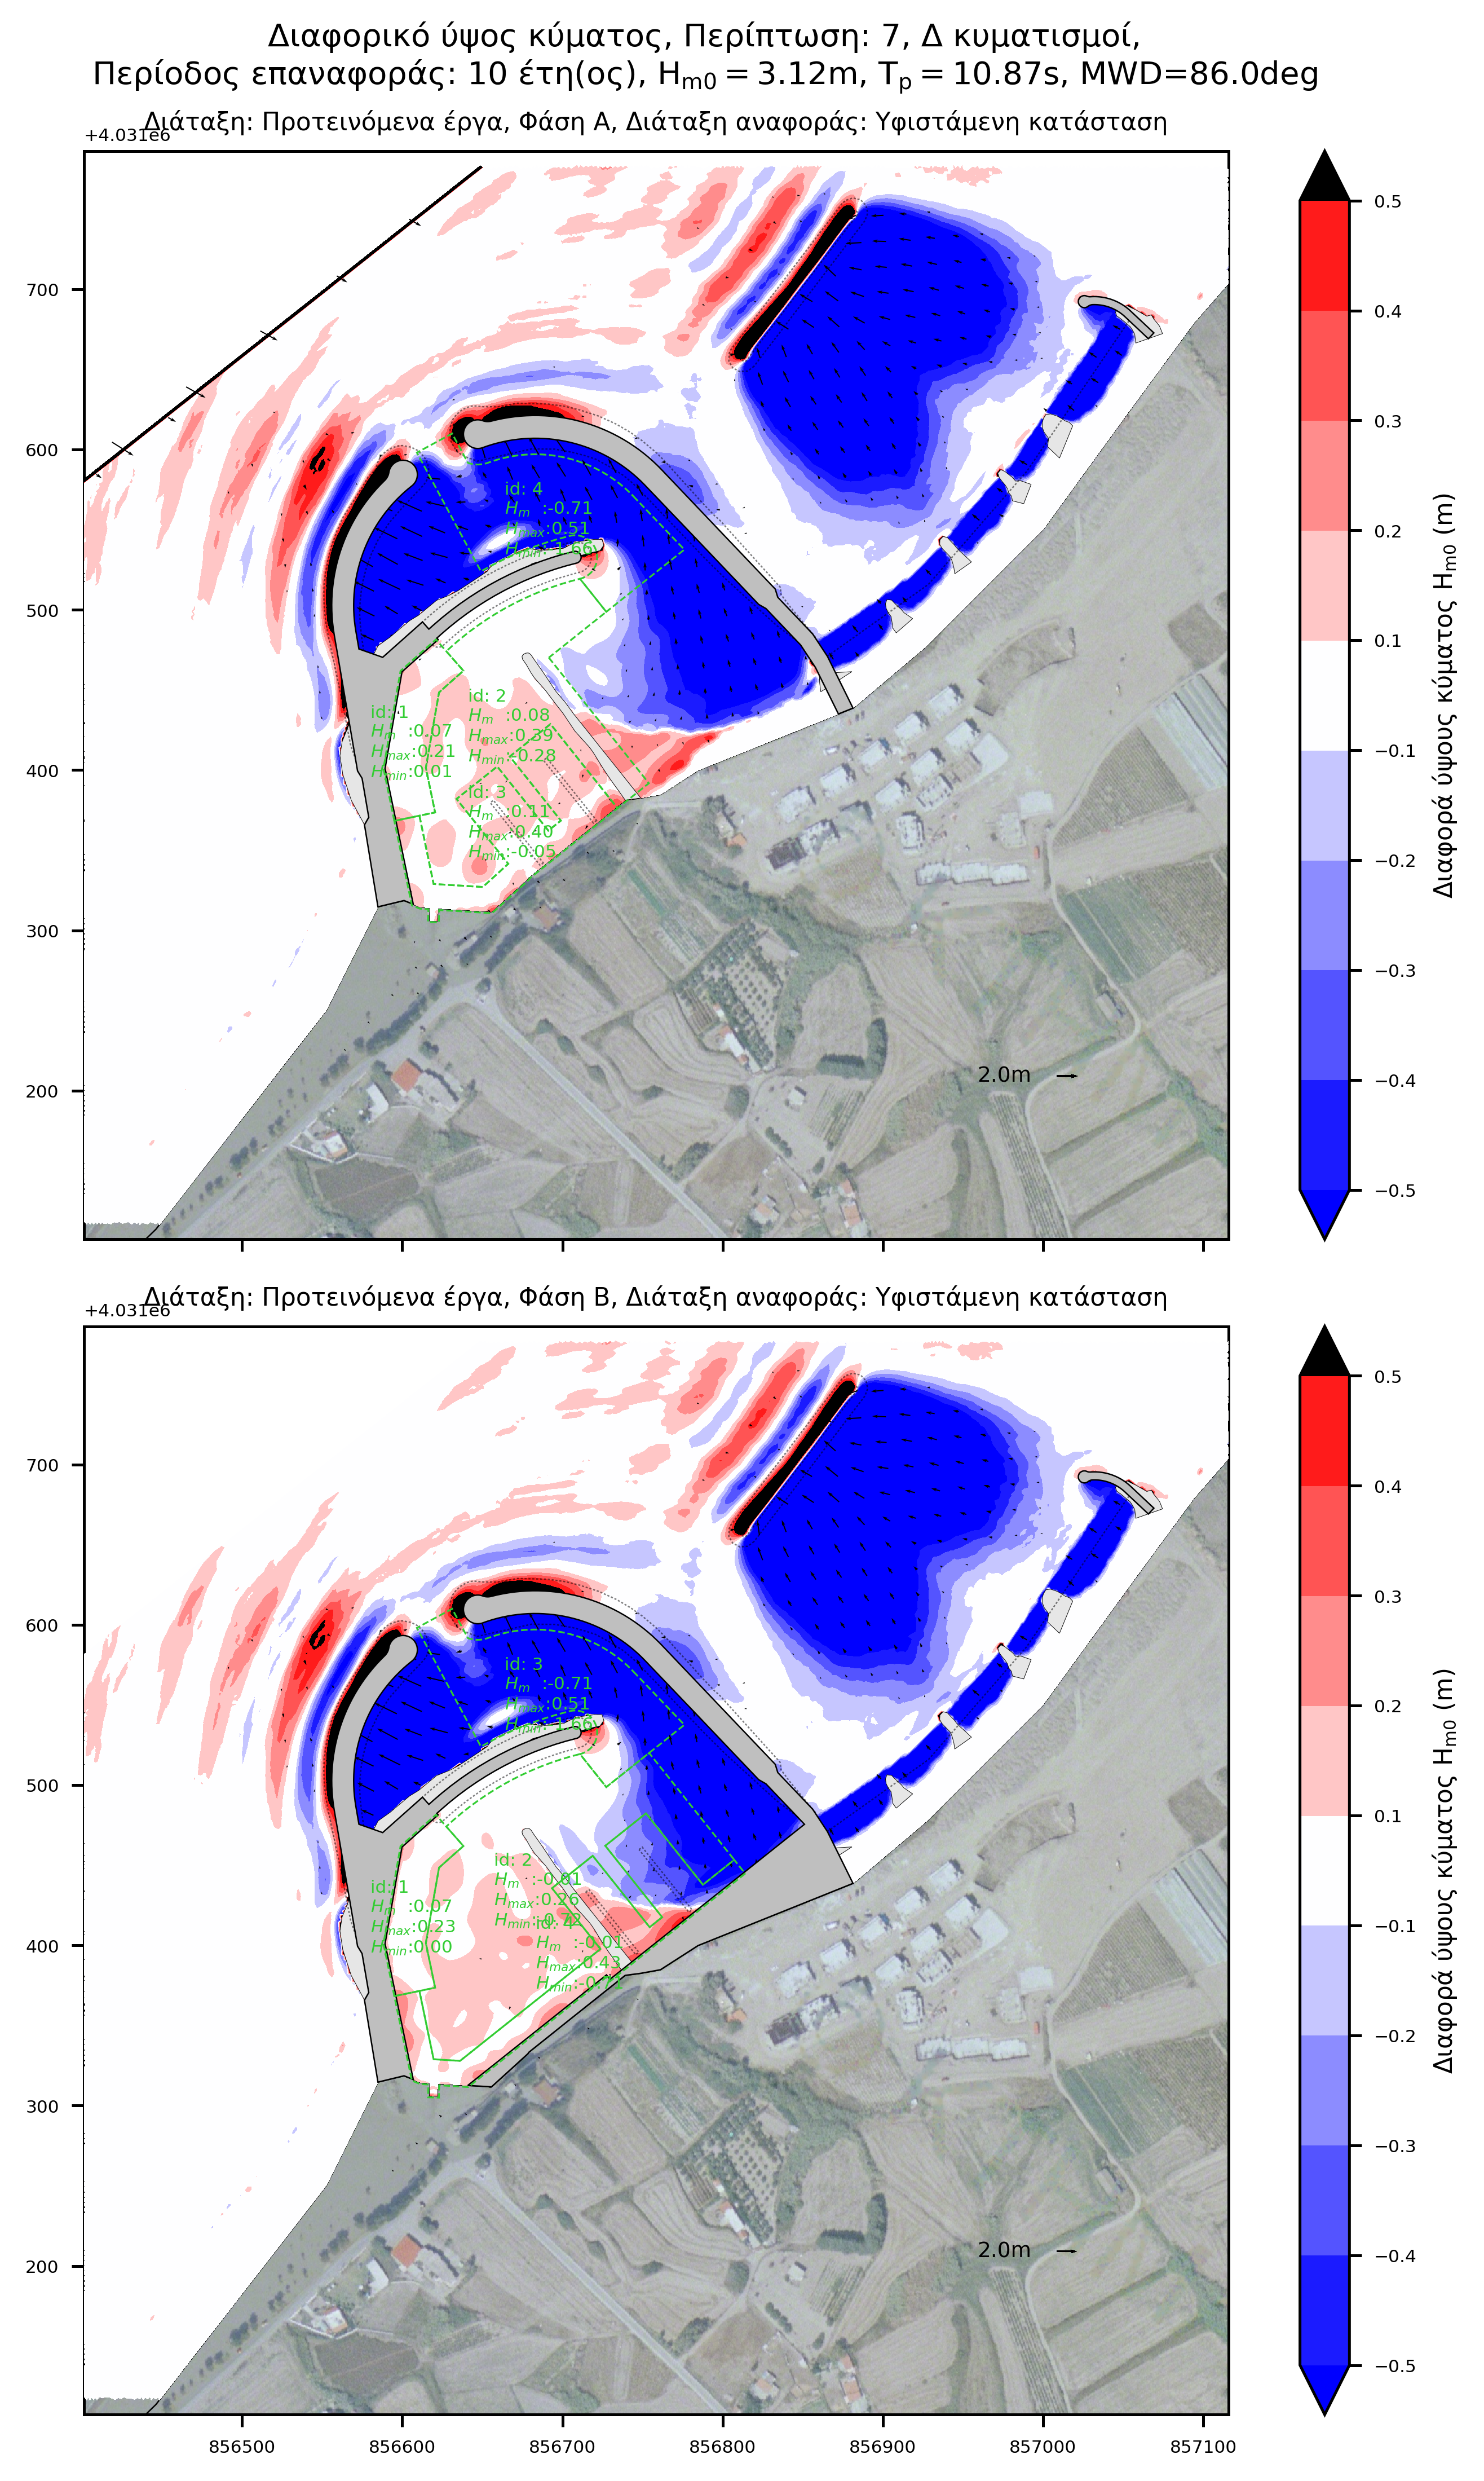
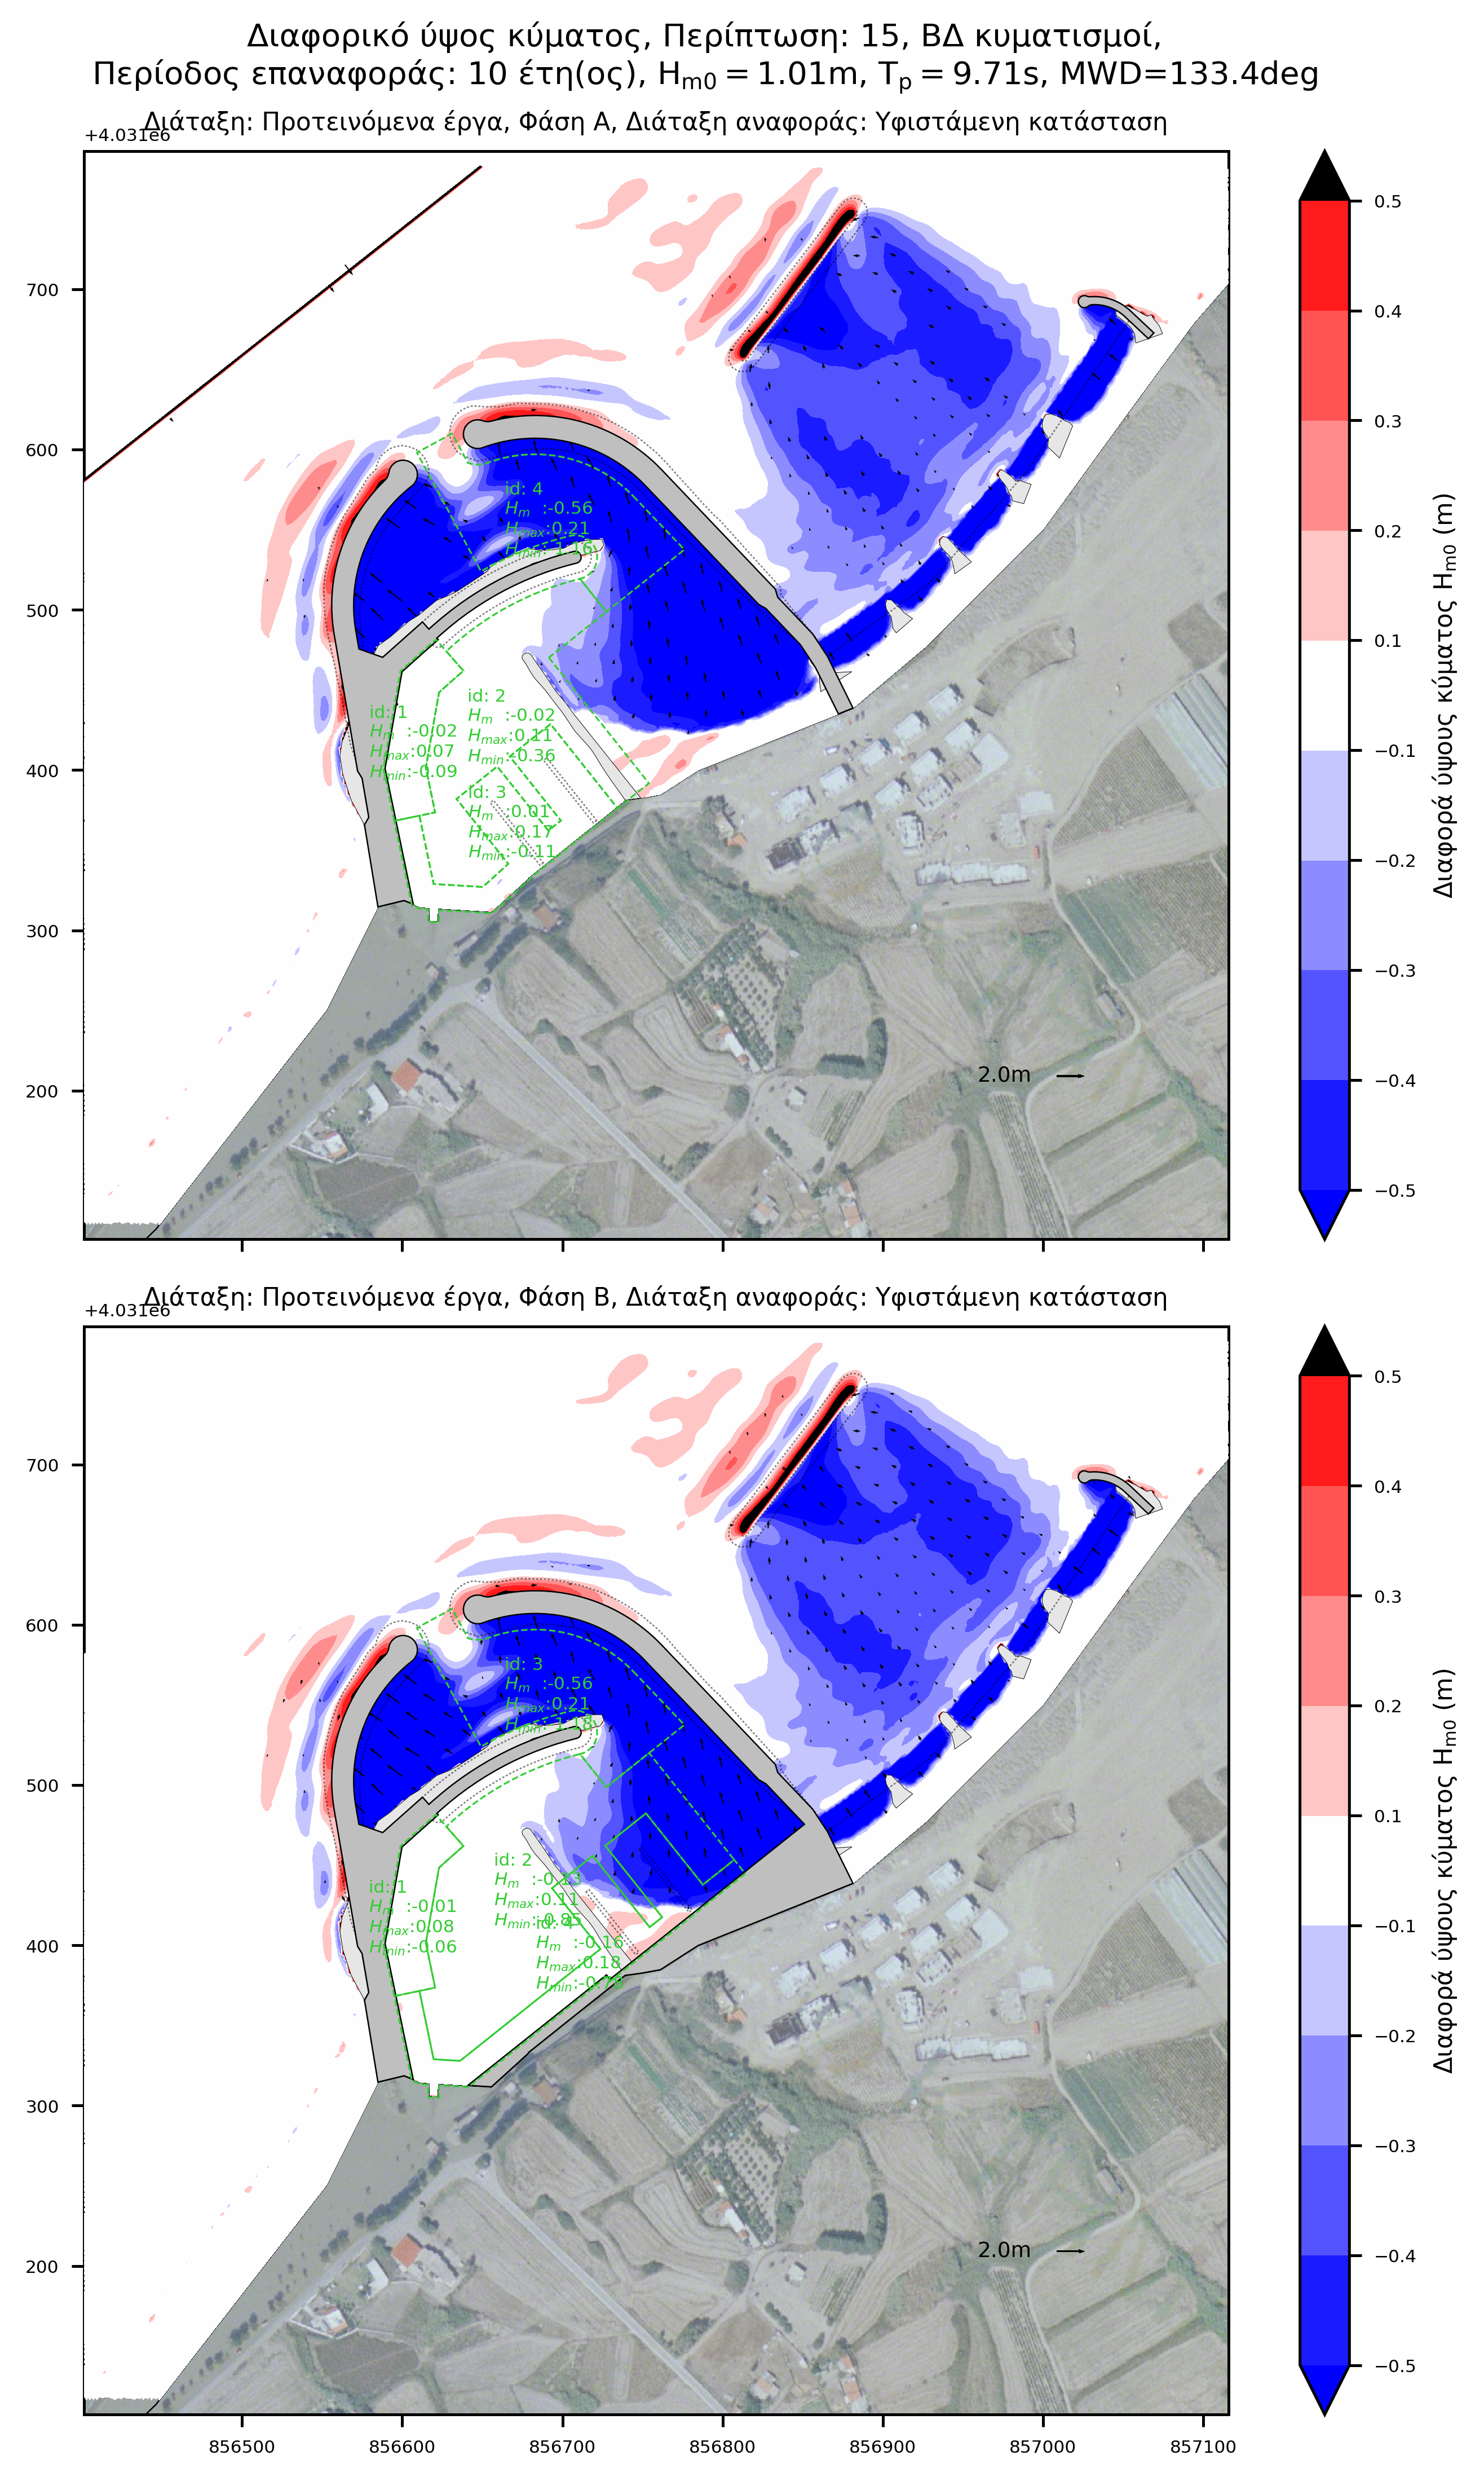
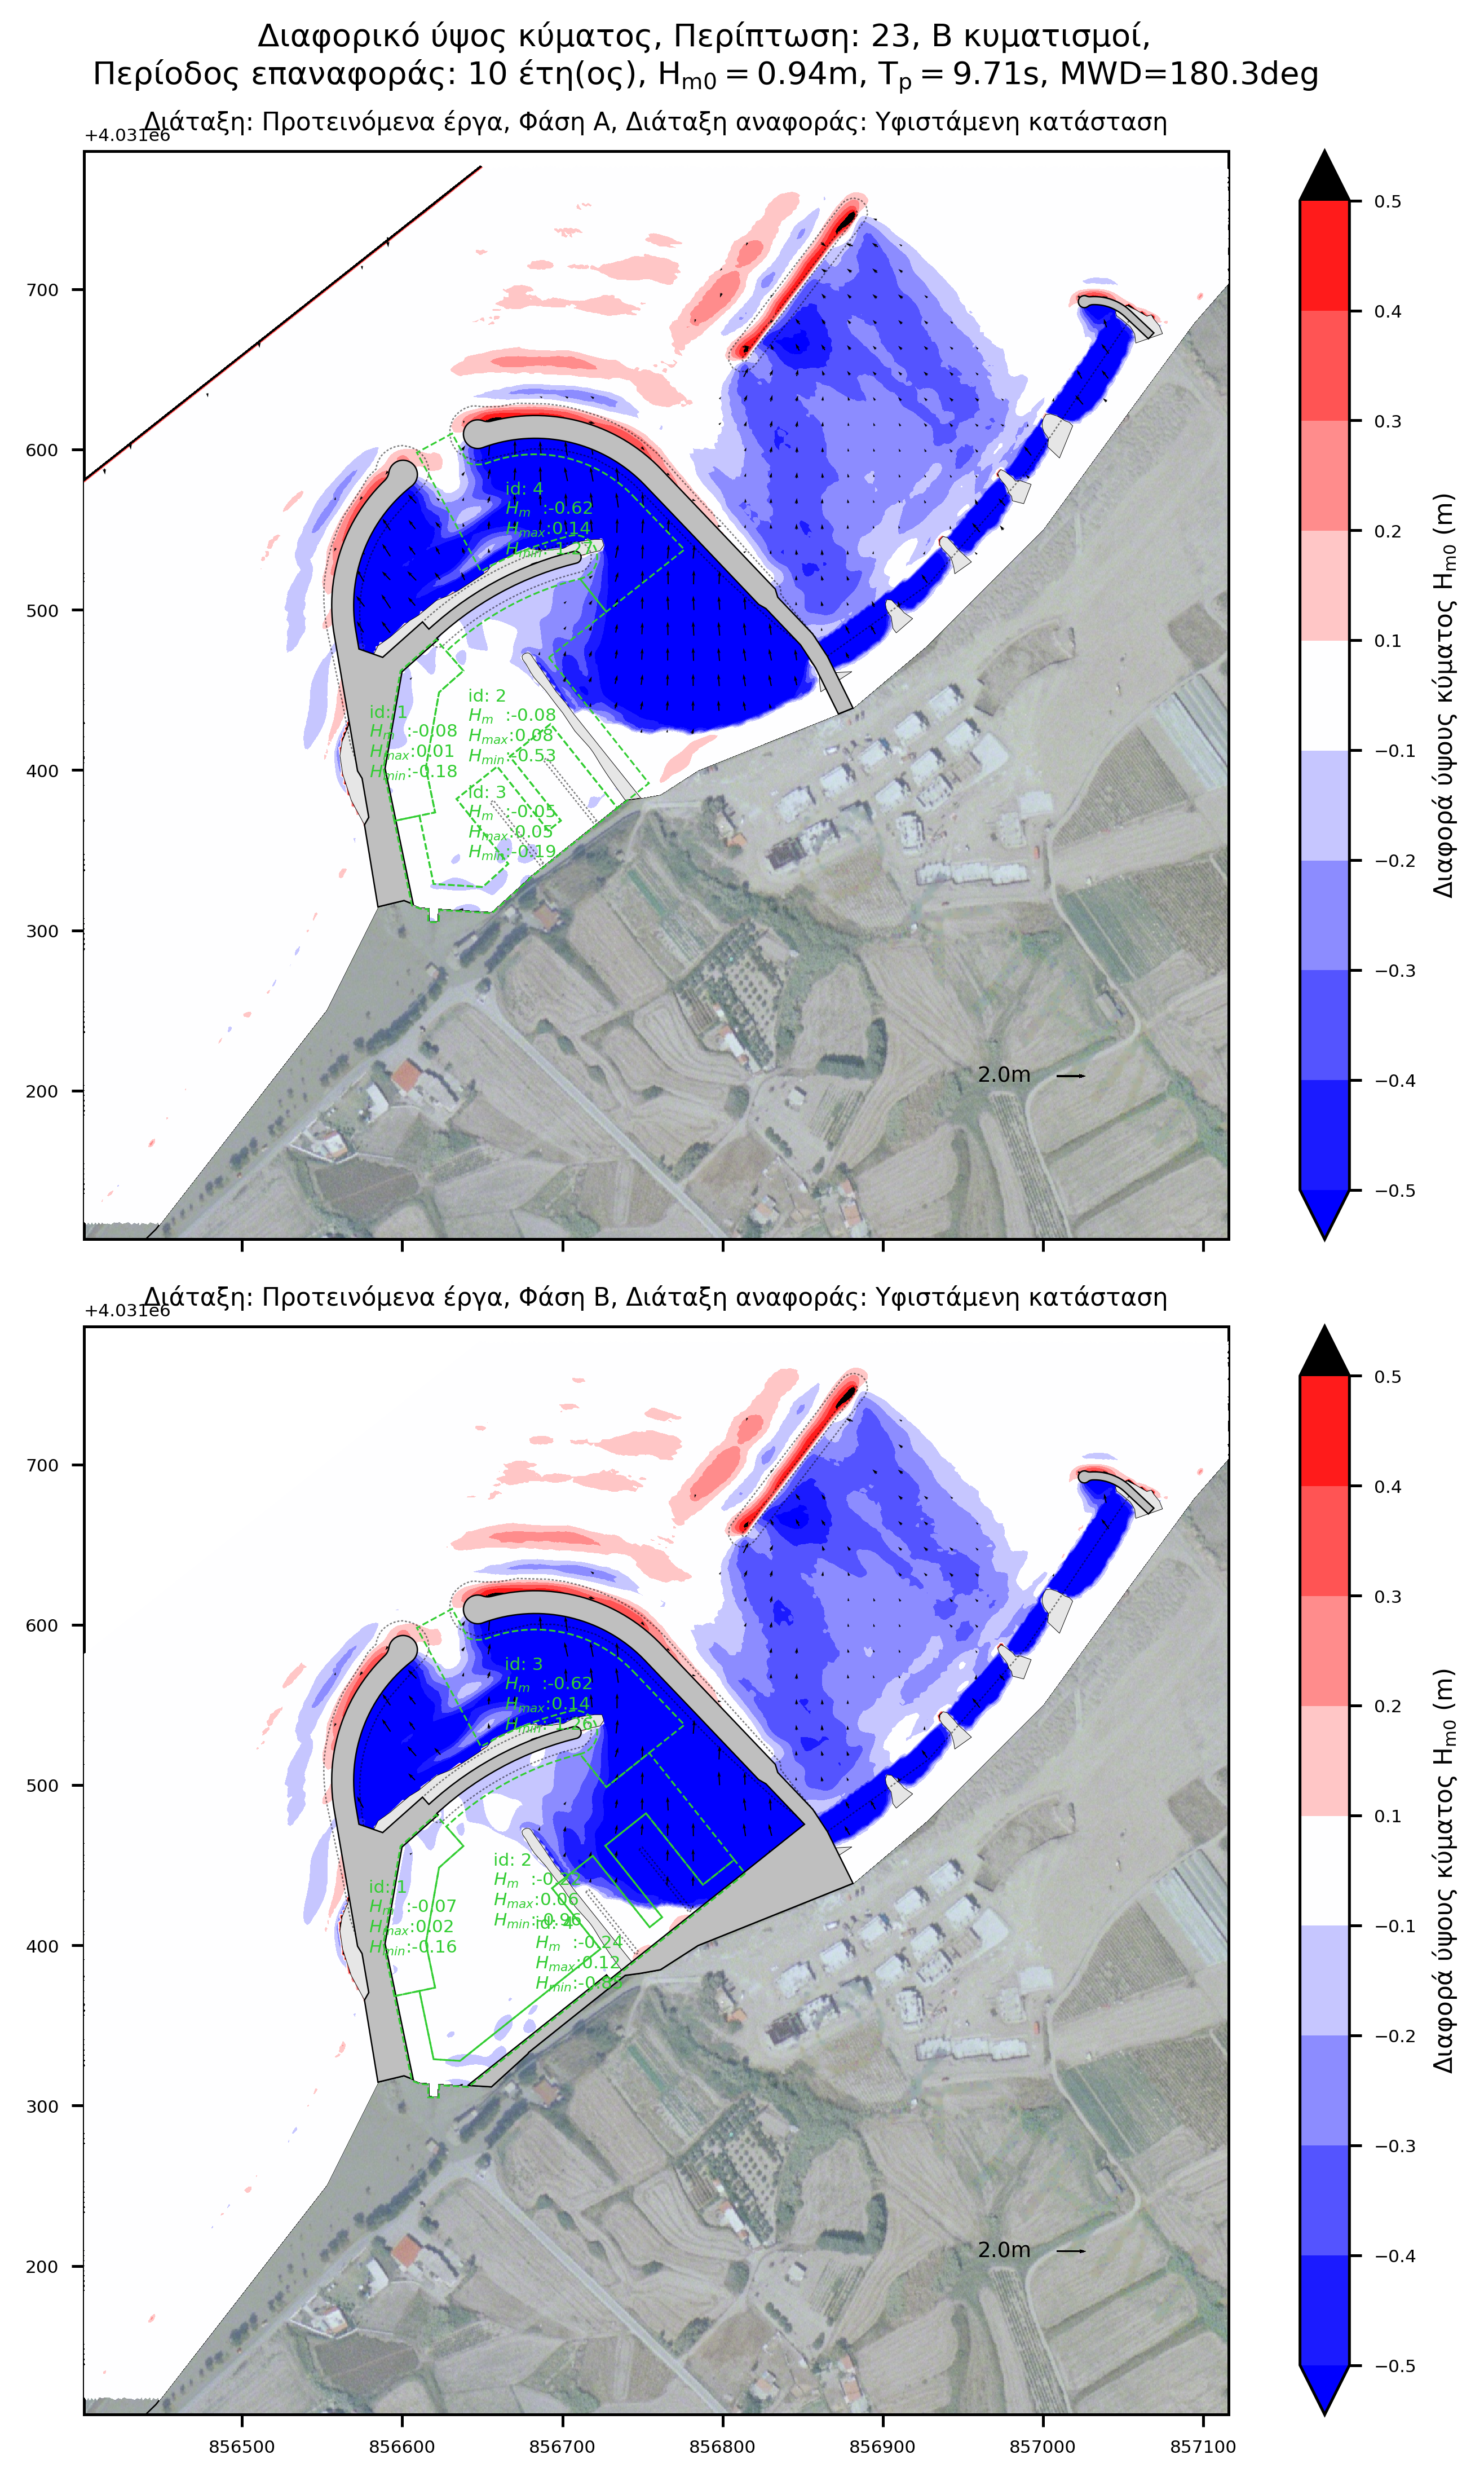
Differential disturbance plots
Differential wave disturbance plots result from the algebraic subtraction of the wave disturbance between the compared layouts. The "Reference Layout" disturbance is subtracted from the disturbance of the solution under consideration. Positive differential disturbance (red gradient), means the layout under consideration causes more disturbance than the reference layout whereas negative differential disturbance (blue gradient), means the layout under consideration causes less disturbance than the reference layout.
This easily identifies the positions as well as the extent to which each layout has an advantage / disadvantage over the "Reference layout". Below is an example of differential wave disturbance for each Phase with respect to the Existing layout.
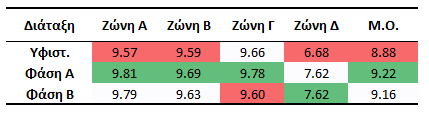
Qualitative analysis
The score is calculated using an evaluation model that takes into account the following wave disturbance parameters for each zone:
- Active wave height (Hm0(rms)),
- Maximum wave height (Hm0(max)),
- Wave height exceeding predefined limits of allowable disturbance (Hm0(exc)),
- Zonal percentage area exceeding predefined limits of allowable disturbance (PAexc).
Conclusion
Based on the results of the analysis it can be concluded that wave disturbance between the existing and the proposed port layout is comparable in all zones with the exception of the approach channel where the existing layout exhibits higher disturbance.
The outer port works are the same in both Phase A and B and the only difference between them is attributed to the inner works where a revetment is constructed in place of the beach. In any case, wave disturbance is considered acceptable.
In conclusion, the proposed works layout in Phase A and B provide equally good berthing conditions.