Wave disturbance study for the Paros port Master Plan
The Wave disturbance study is complementary to the project entitled "Paros Port Master Plan", commissioned to CNWAY in April 2016.
Scope
Wave disturbance analysis serves as a decision making tool which enables port layout optimization through the assessment of berthing conditions. The scope of the study is to investigate wave conditions in the proposed port layout (as set out in the master plan), assess how this compares with the existing conditions and provide evidence that the proposed berthing facilities are acceptable from this standpoint.
Numerical modeling
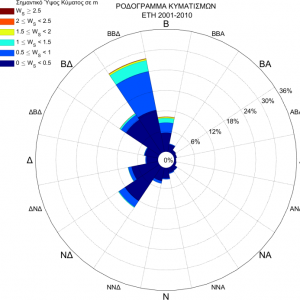
Wave climate
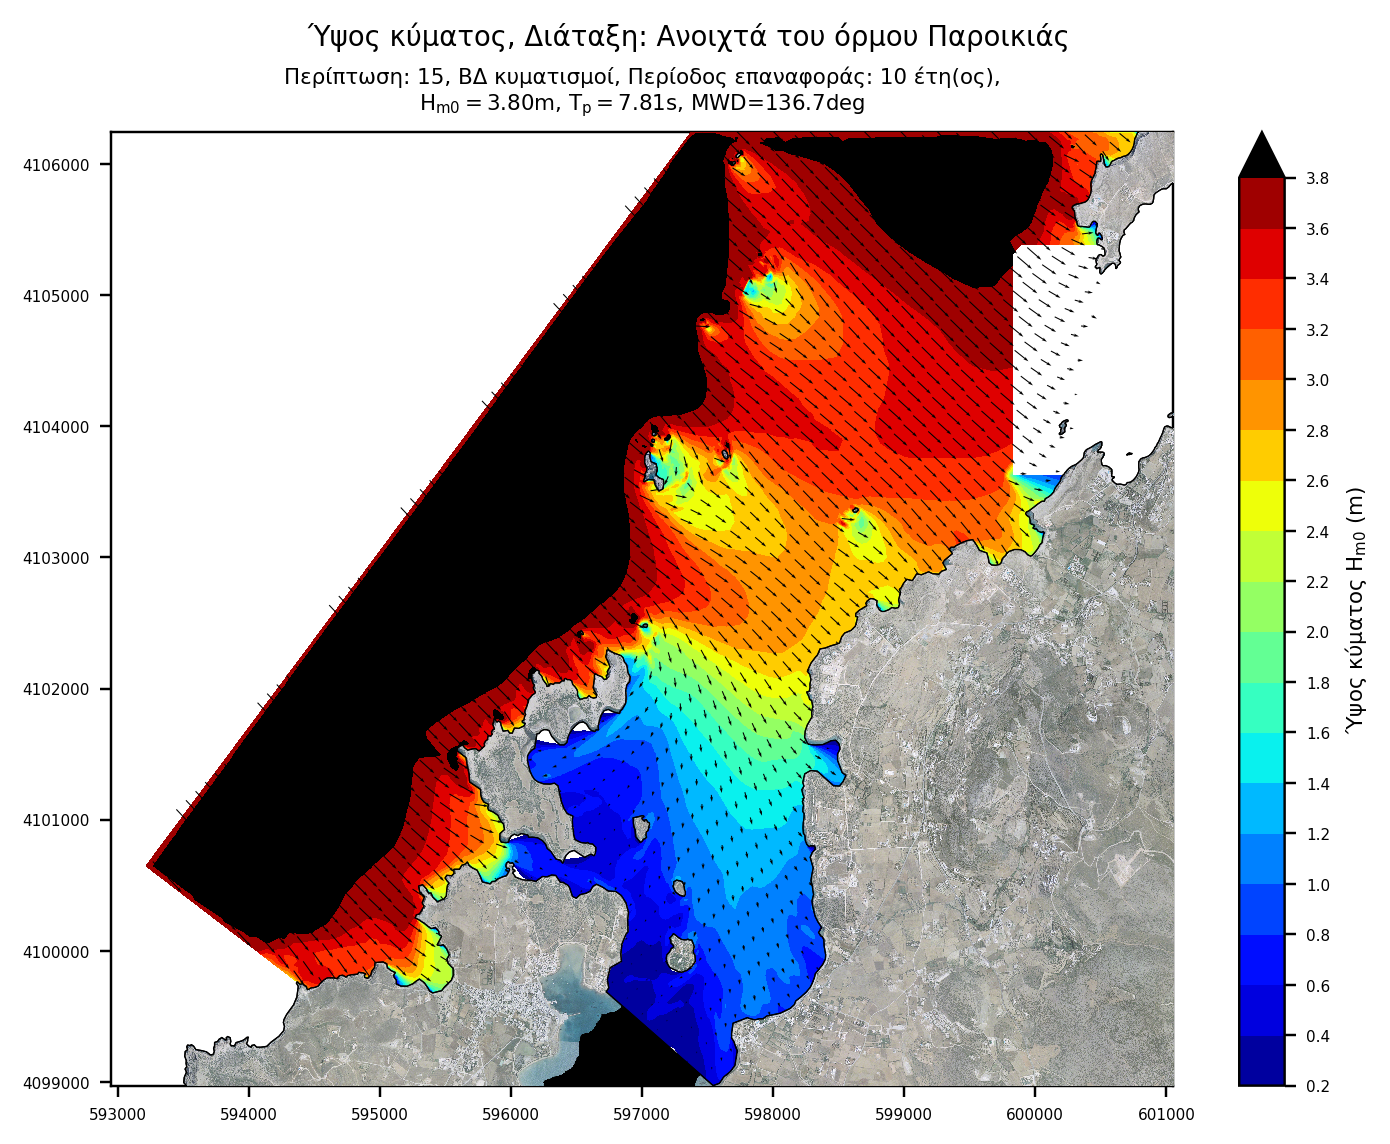
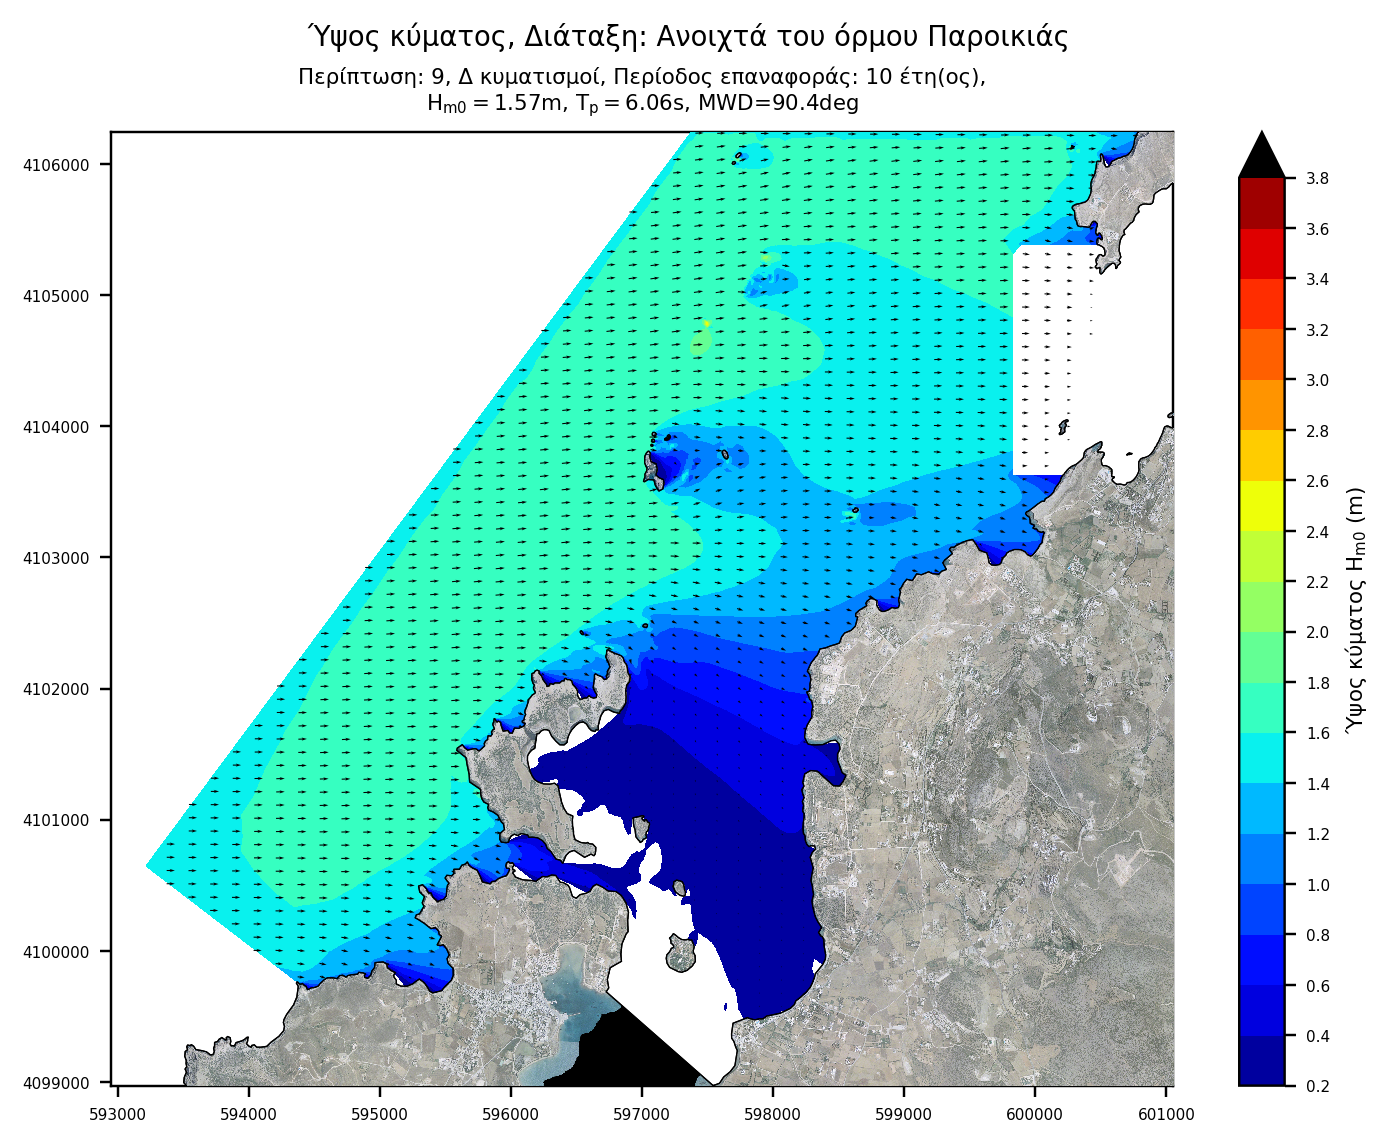
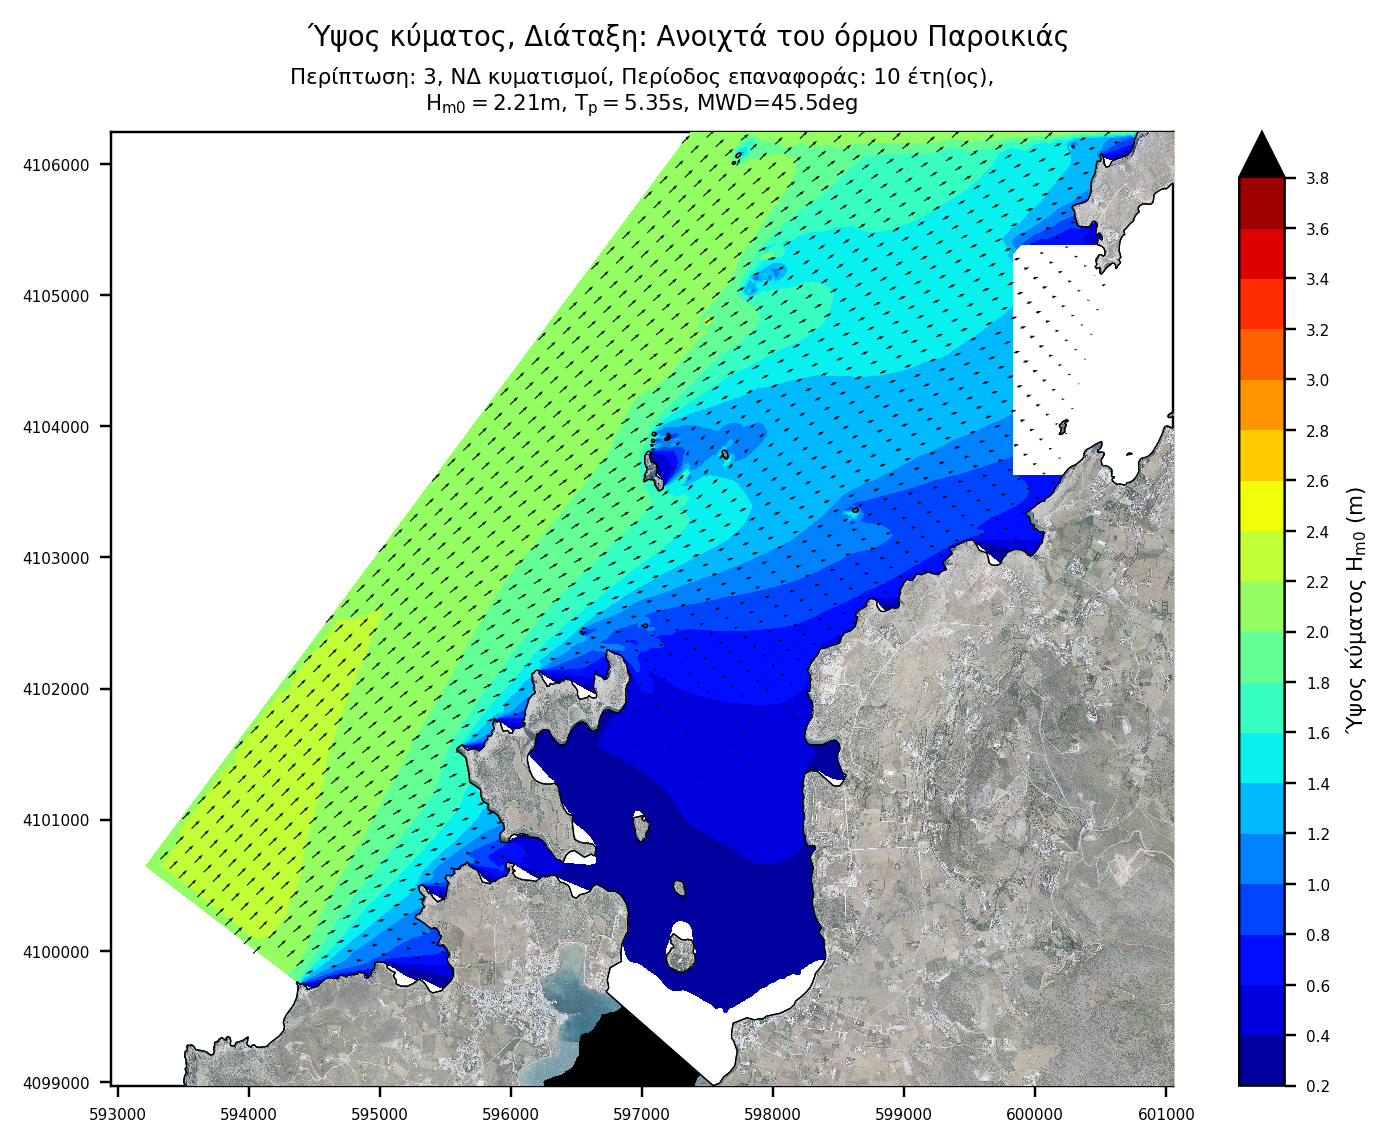
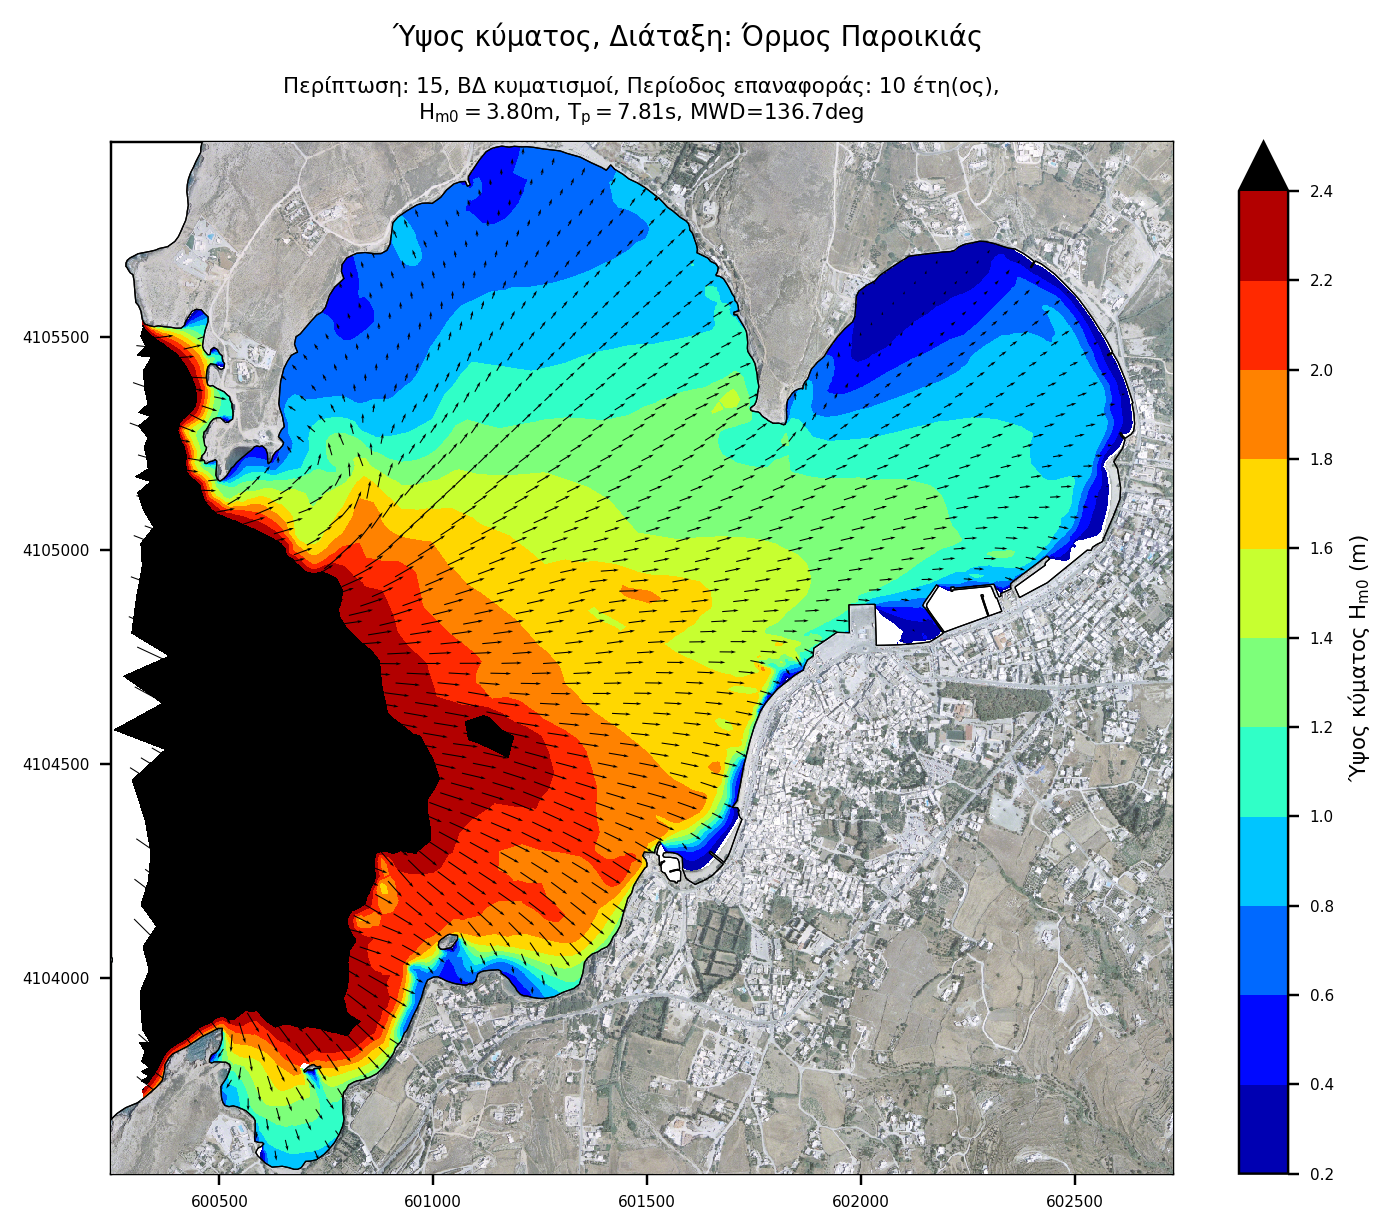
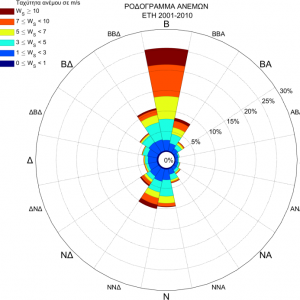
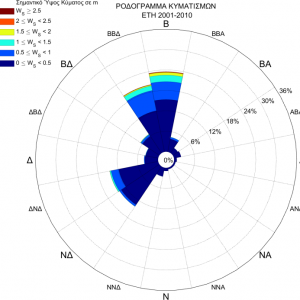
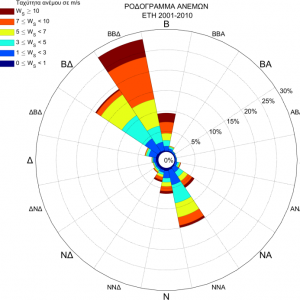
Wave and wind data are derived from the WAMC4 and Skiron/Eta forecast model. There are two nodes located offshore with coordinates as shown below:
- Node 222, latitude of 37.050 and longitude of 25.050
- Node 223, latitude of 37.100 and longitude of 25.100
Node 222 and 223 is located 4,8 and 9,8 kilometers away from the project site respectively. The duration of the dataset covers the period between 2001 and 2010.
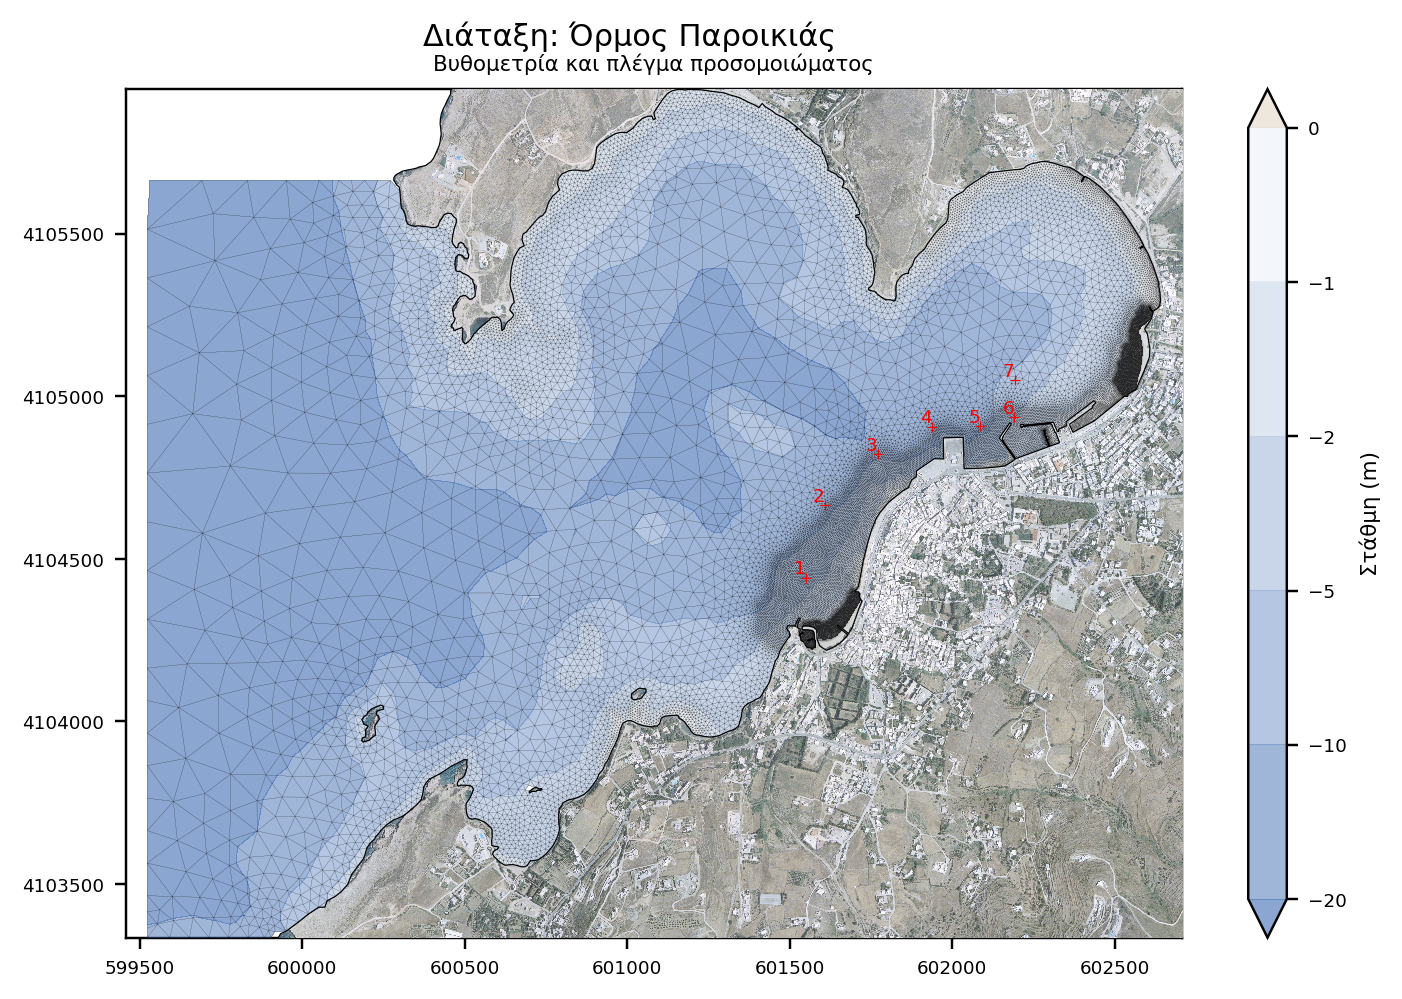
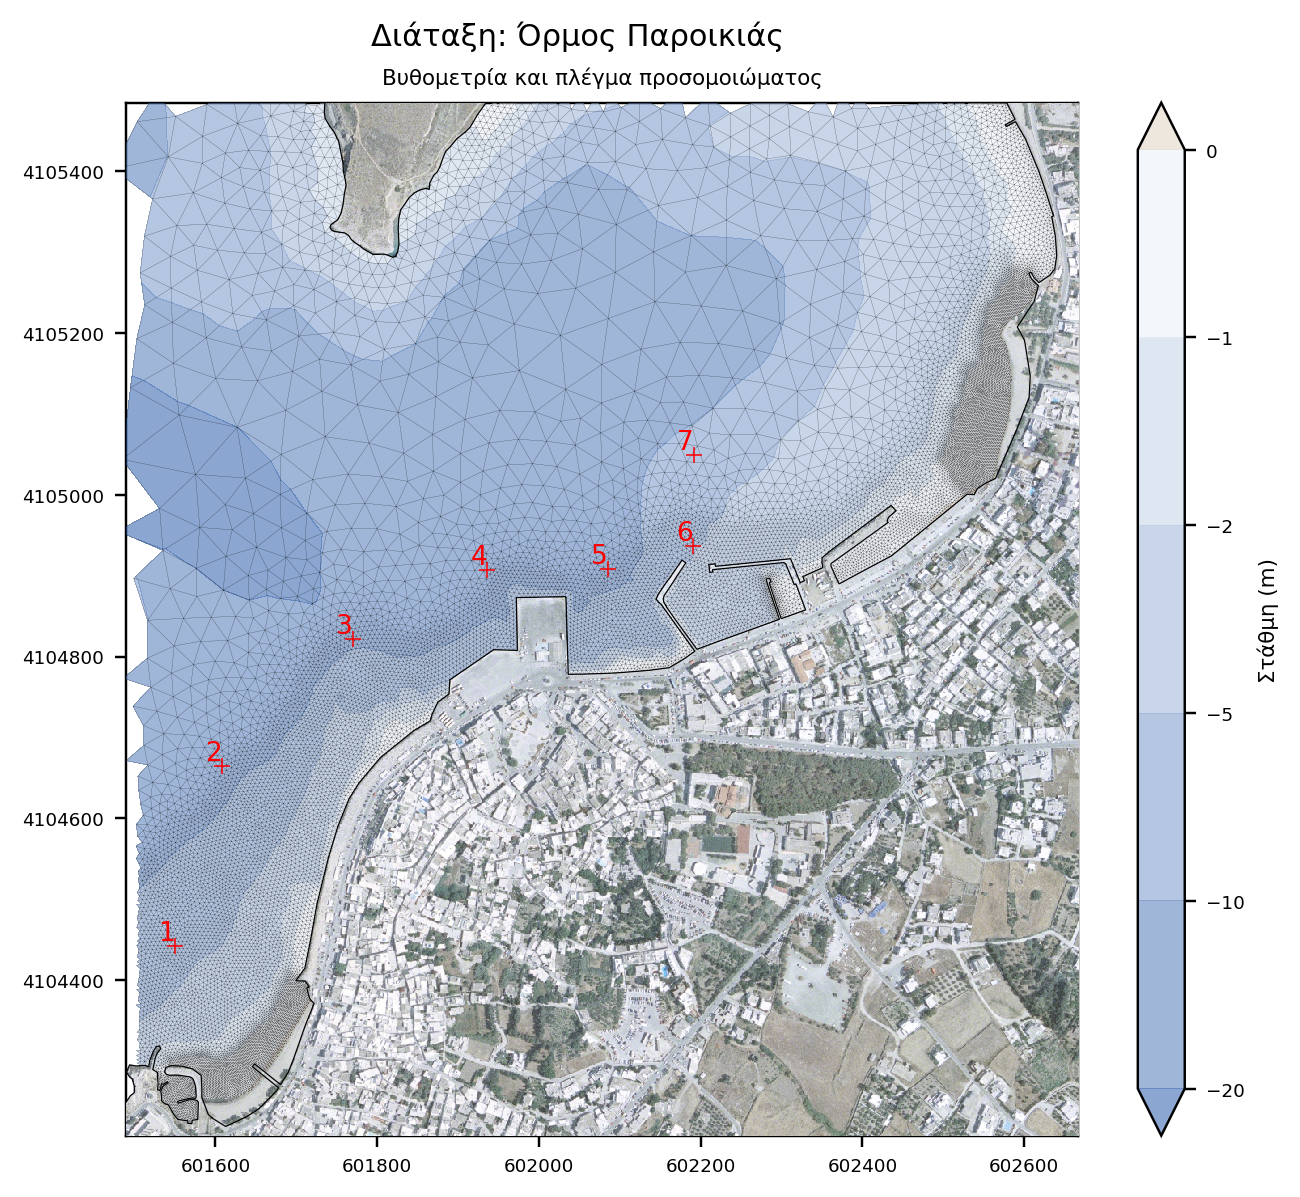
Modeling characteristics
The simulation is usually performed by employing three (3) separate models, the offshore, the nearshore and the wave disturbance model. The first extends from the position of offshore wave conditions (the node of the WAM wave model) up to the Parikia bay entrance, and its role is to prescribe boundary conditions to the nearshore model which in turn provides boundary condition (wave spectrum) to the wave disturbance model.
Offshore and nearshore model
- Offshore model: It extends 7,3 km along the E-W axis and 7,3 km laterally. It covers an area of approximately 30,3 km2 and consists of 108.000 elements and 55.000 nodes
- Nearshore model: It extends 3,2 km along the E-W axis and 2,5 km laterally. It covers an area of approximately 4,9 km2 and consists of 51.000 elements and 27.000 nodes

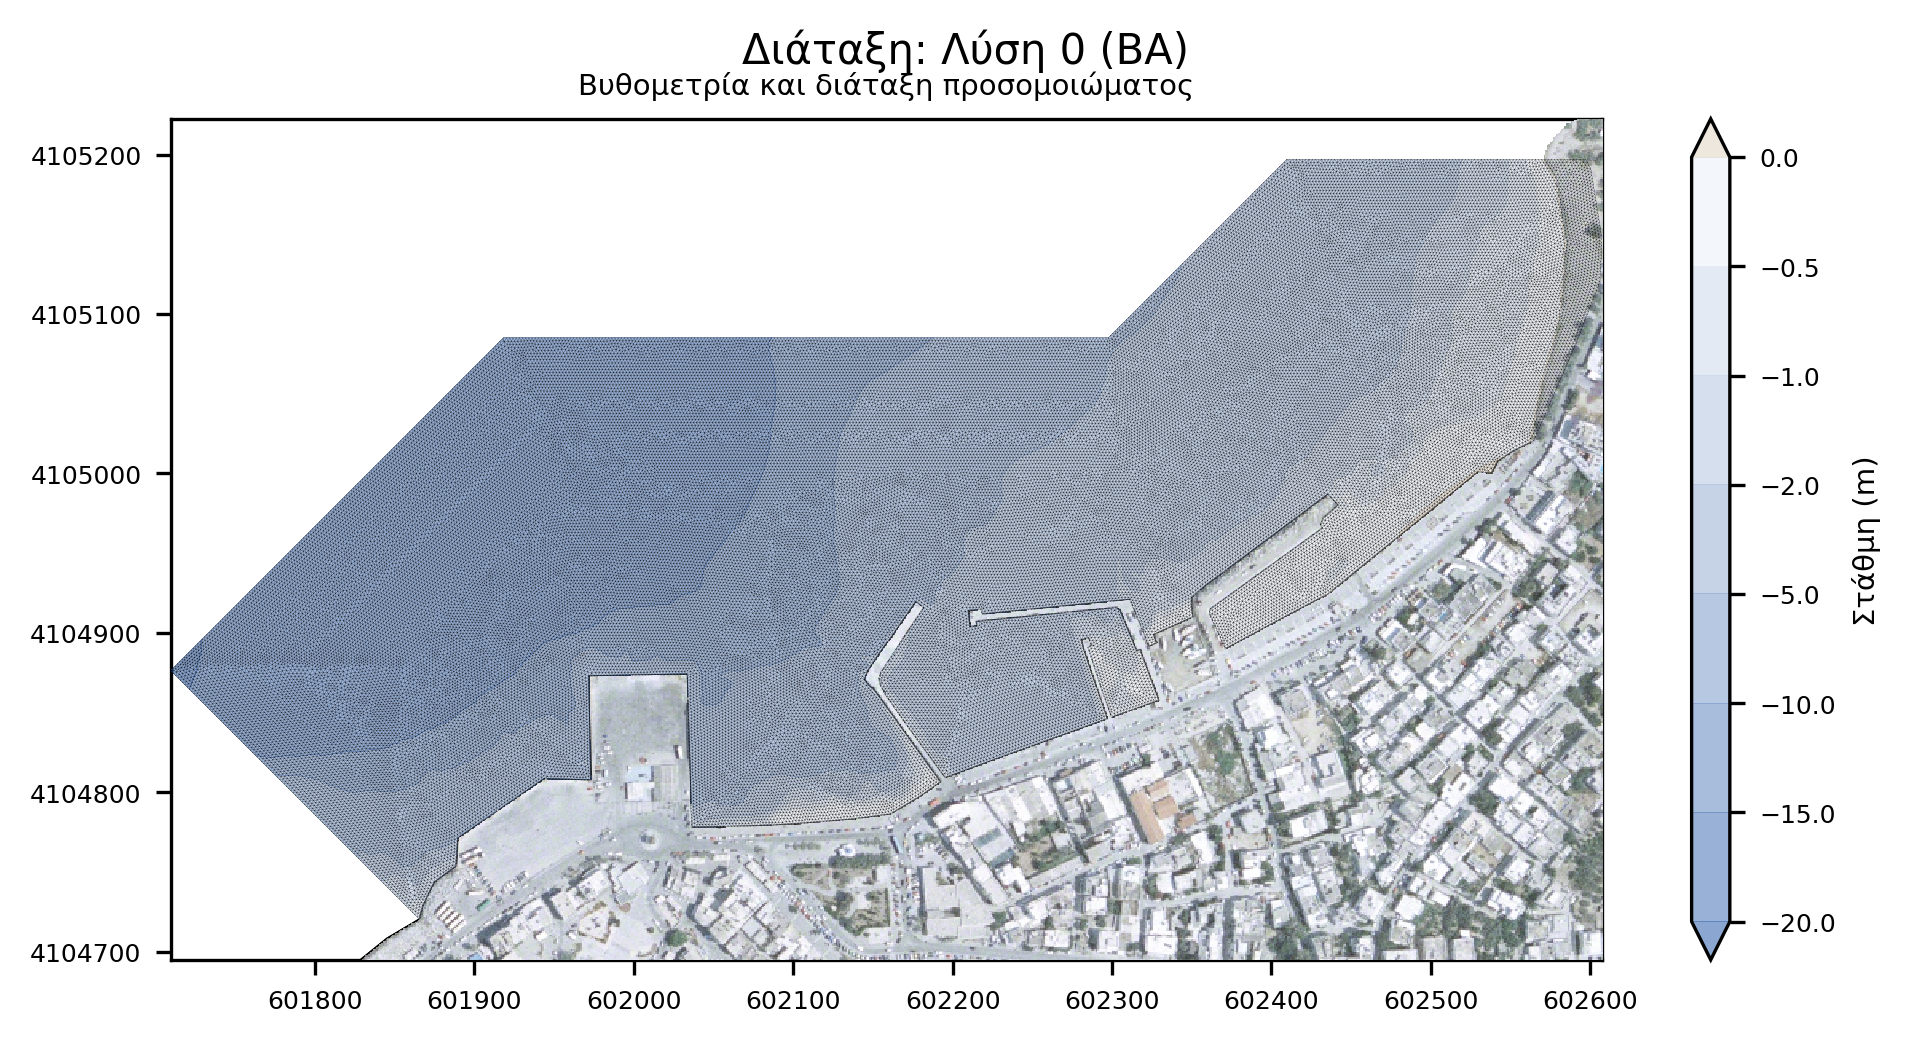
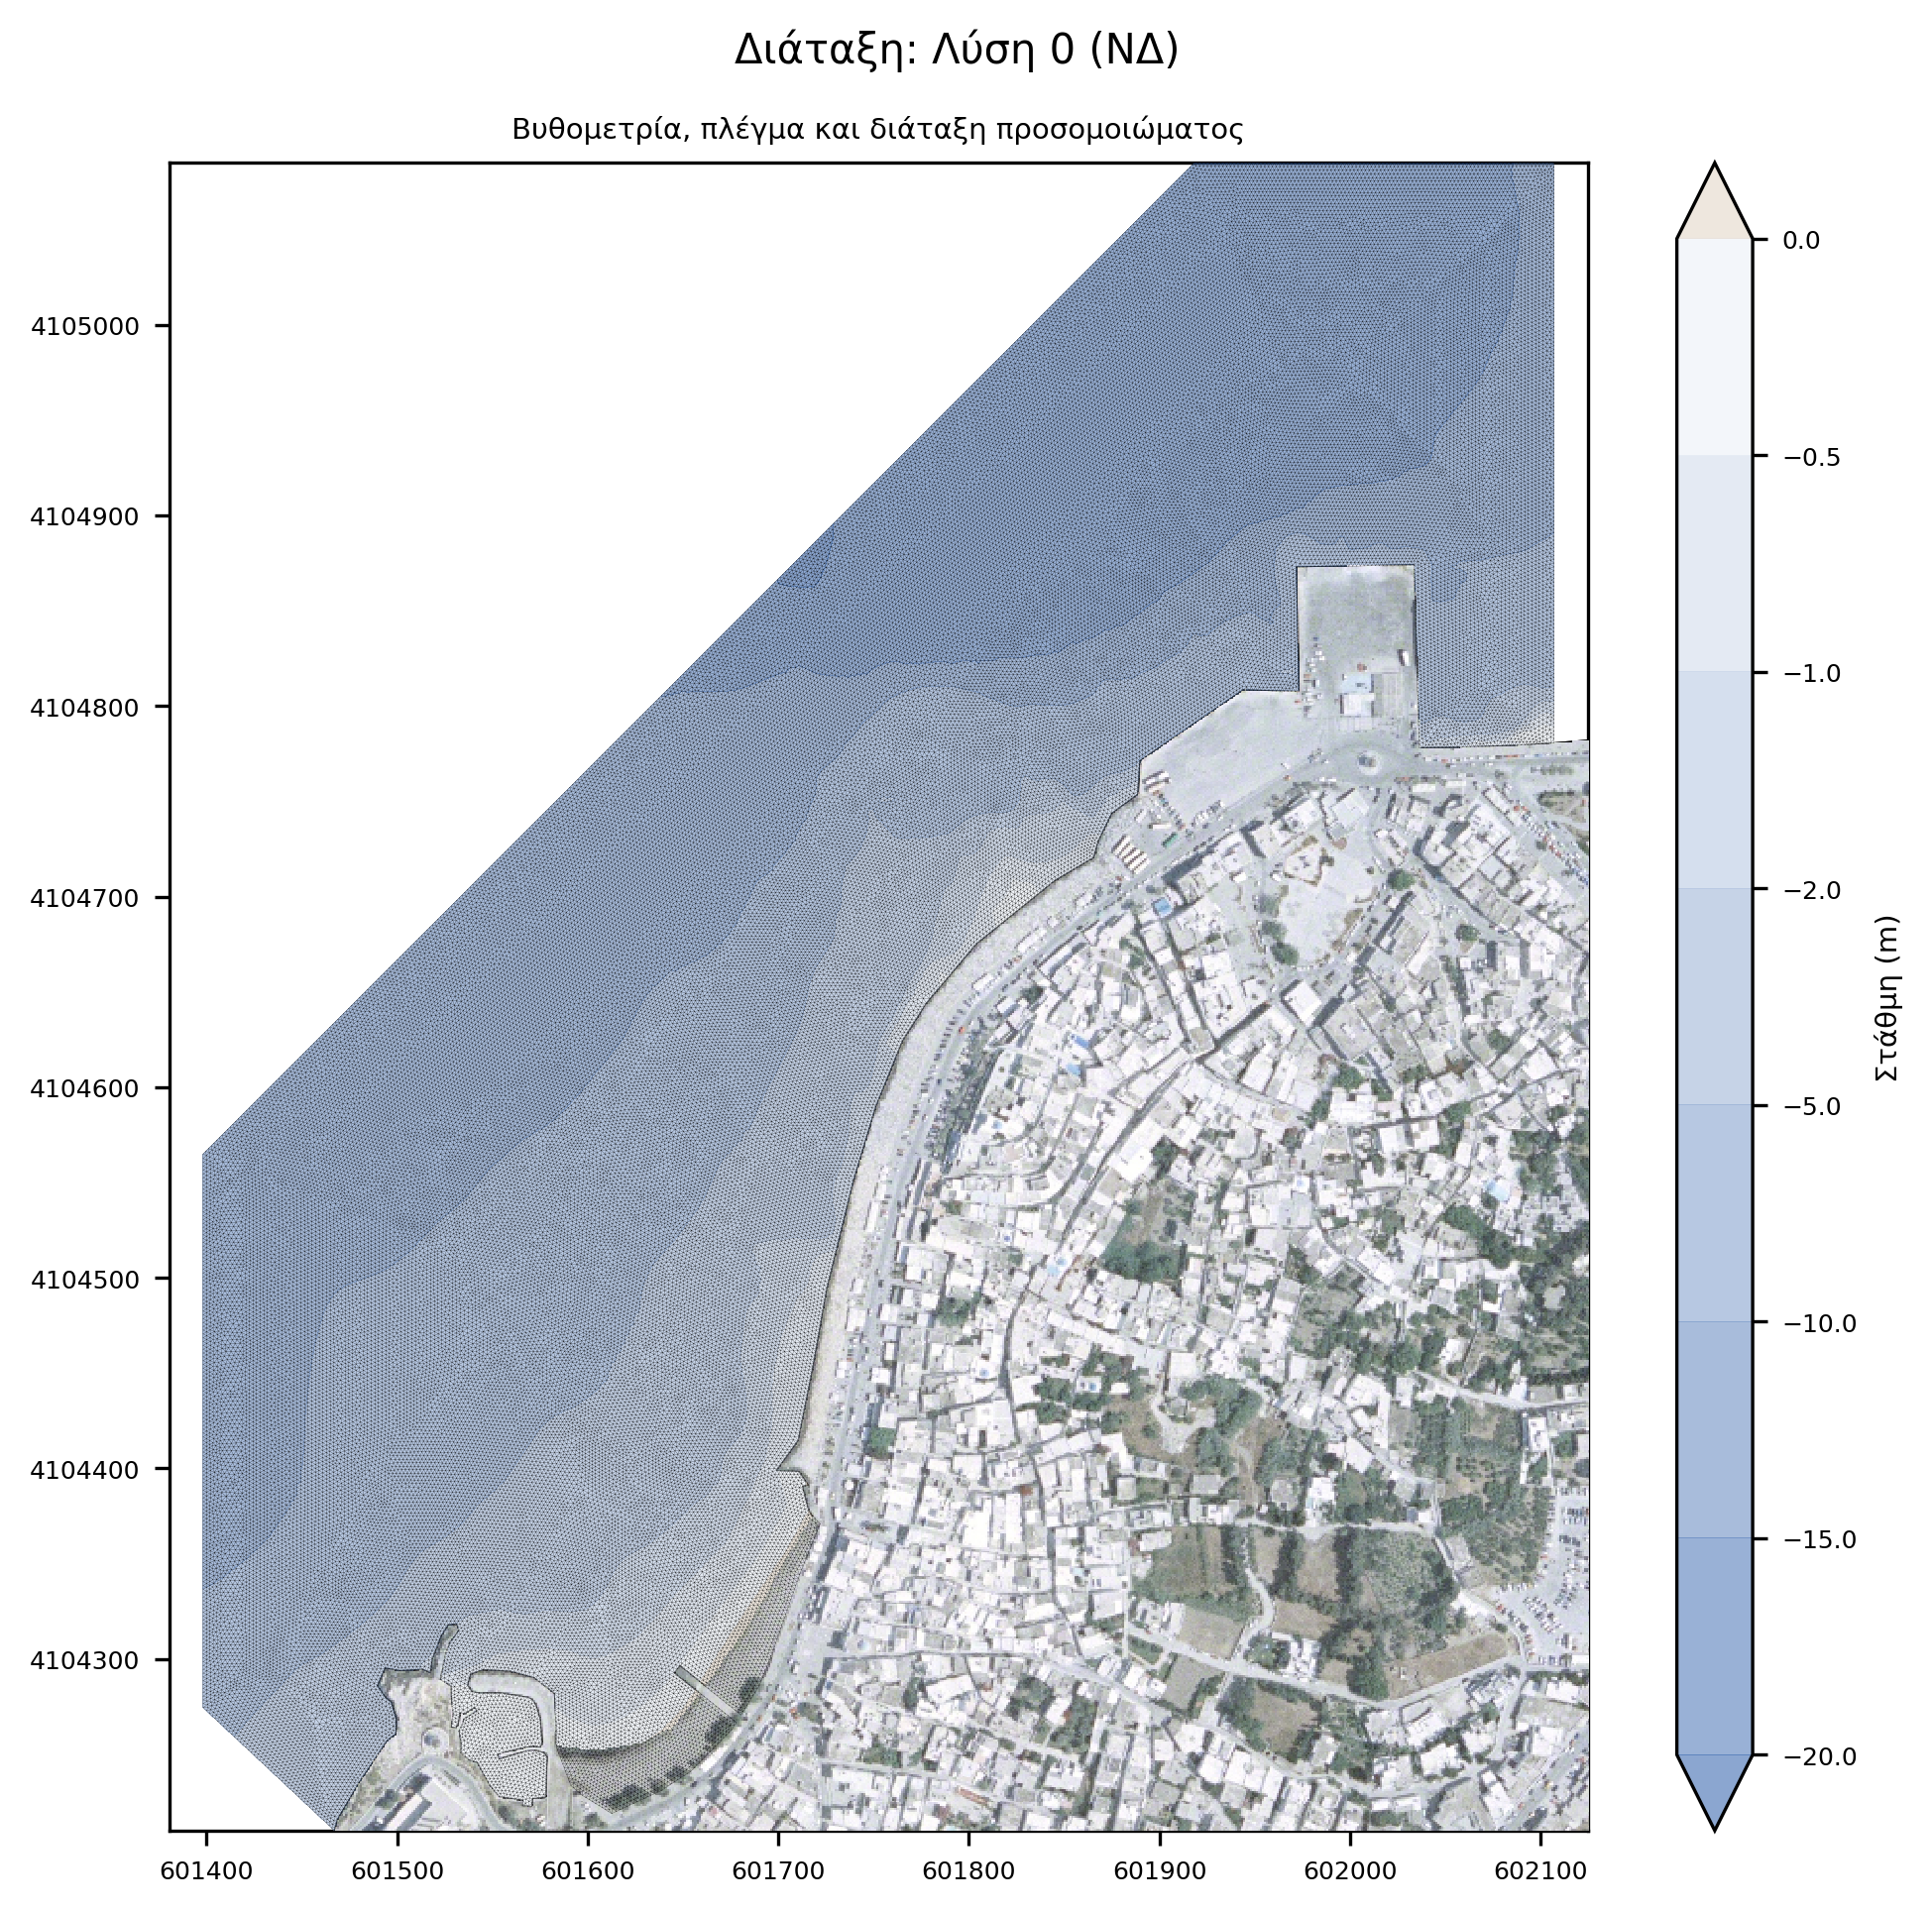
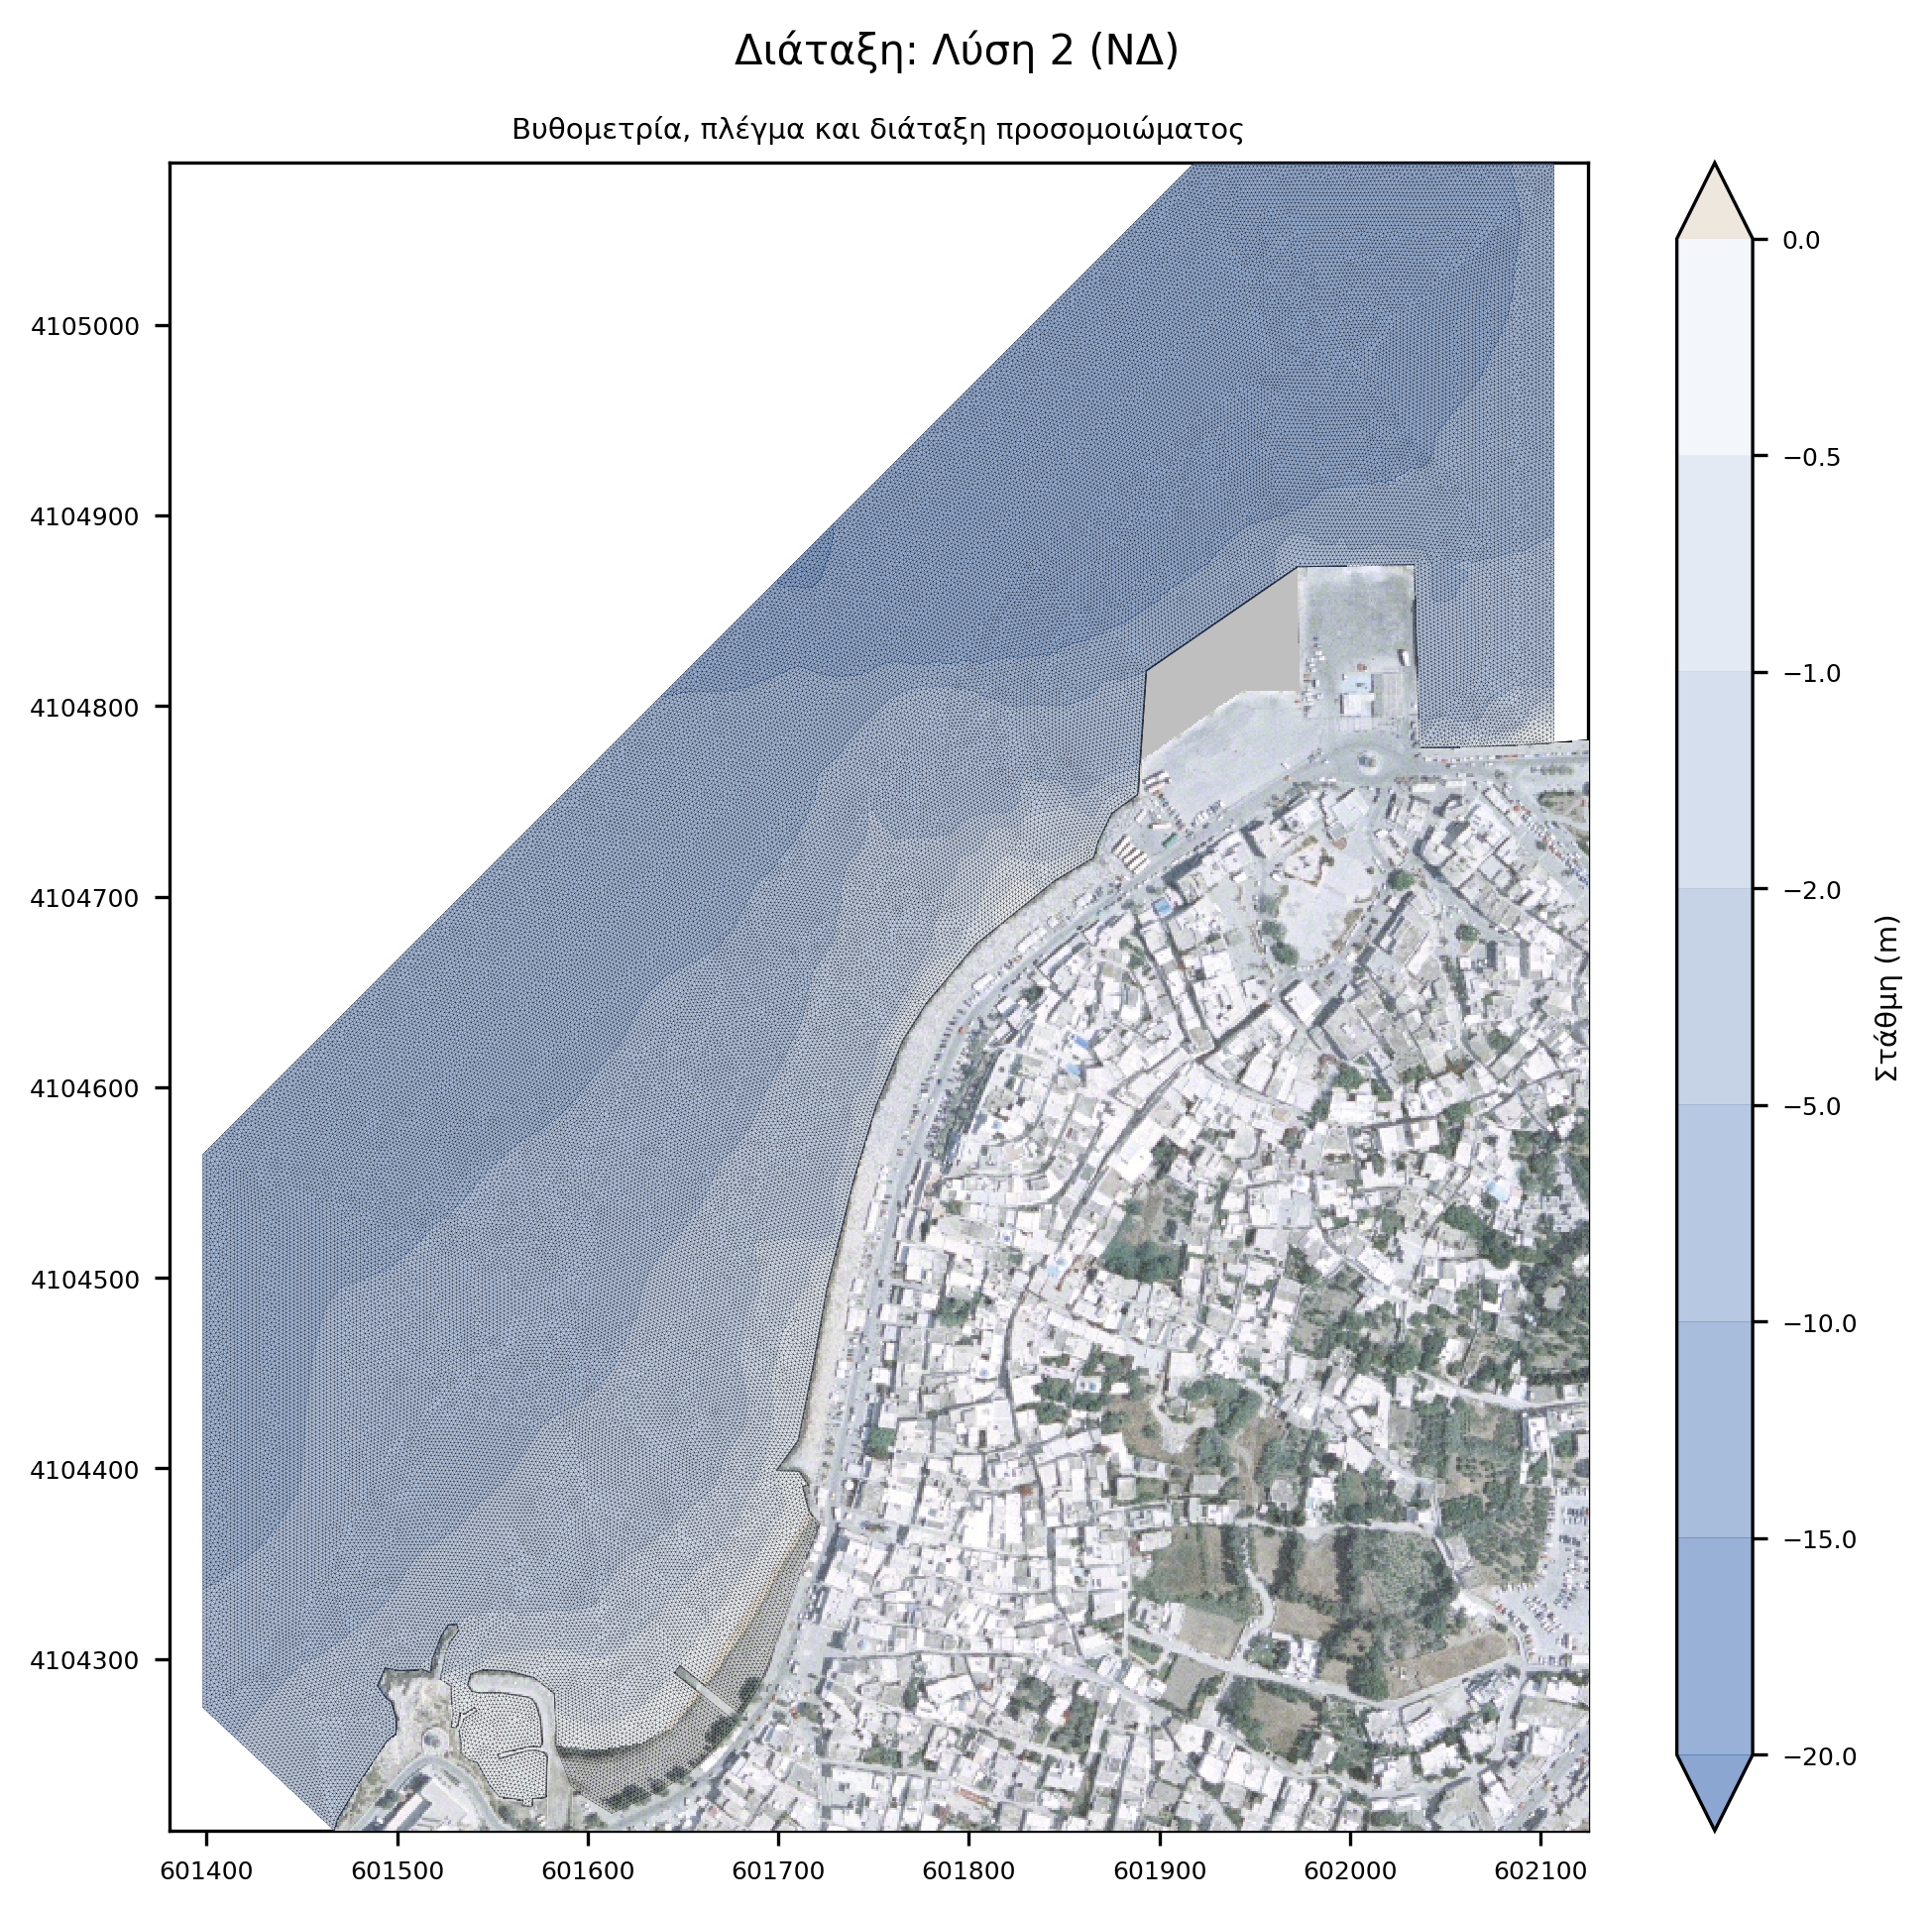
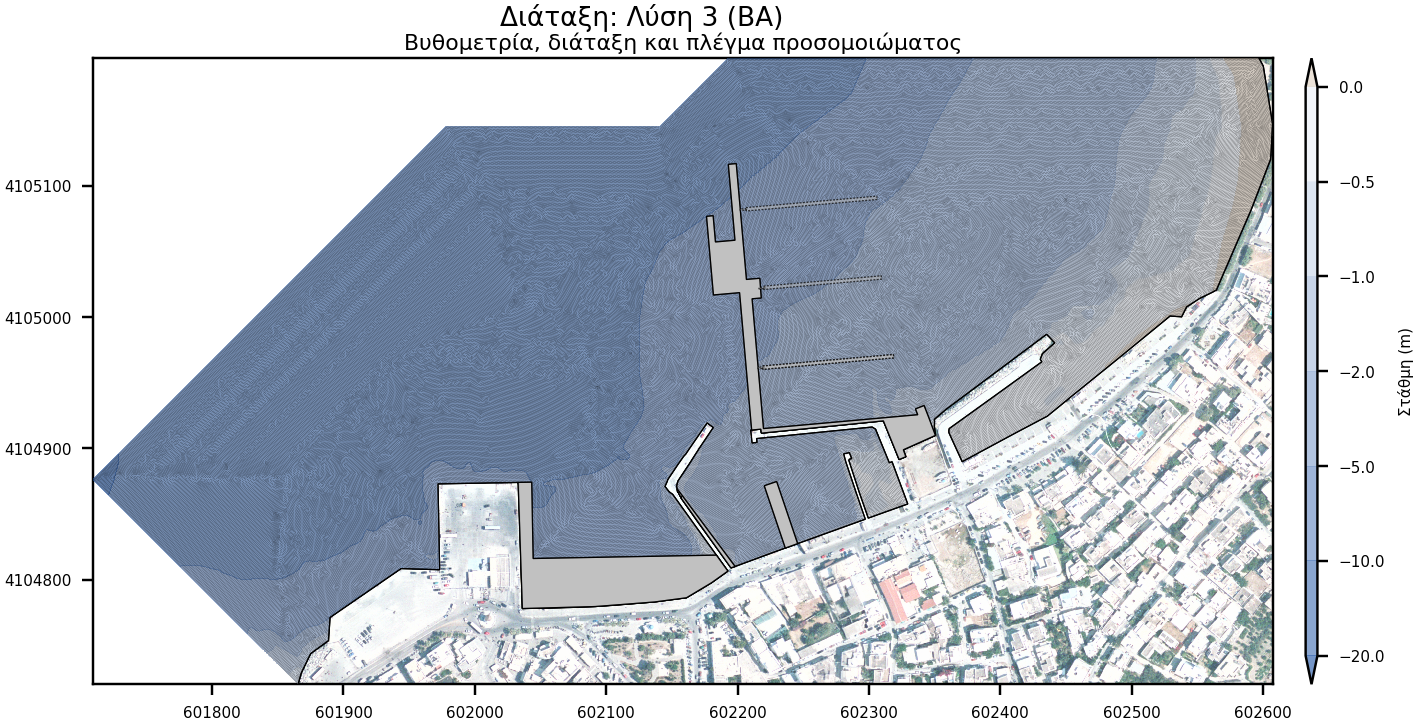
Wave disturbance model
The model domain was divided into two (2) sub-domains, namely, the southwest (SW) and the northeast (NE). Due to their location, the former is subject to higher wave exposure compared to the latter which is more sheltered.
- SW domain: It extends 1000 meters along the SW-axis and 400 meters laterally. It covers an area of about 0.26 km2 and consists of about 140,000 elements and 70,000 nodes.
- NE domain: It extends 950 meters along the W-axis and 400 meters laterally. It covers an area of about 0.21 km2 and consists of about 112,000 elements and 56,000 nodes.


Simulations
A total of 21 wave cases corresponding to 210 simulations were executed, which consist of:
- 21 TOMAWAC simulations to propagate wave conditions from the WAMC4 regional model node to the entrace of Parikia bay,
- 21 TOMAWAC simulations to propagate wave conditions from the entrace of Parikia bay to the area of works,
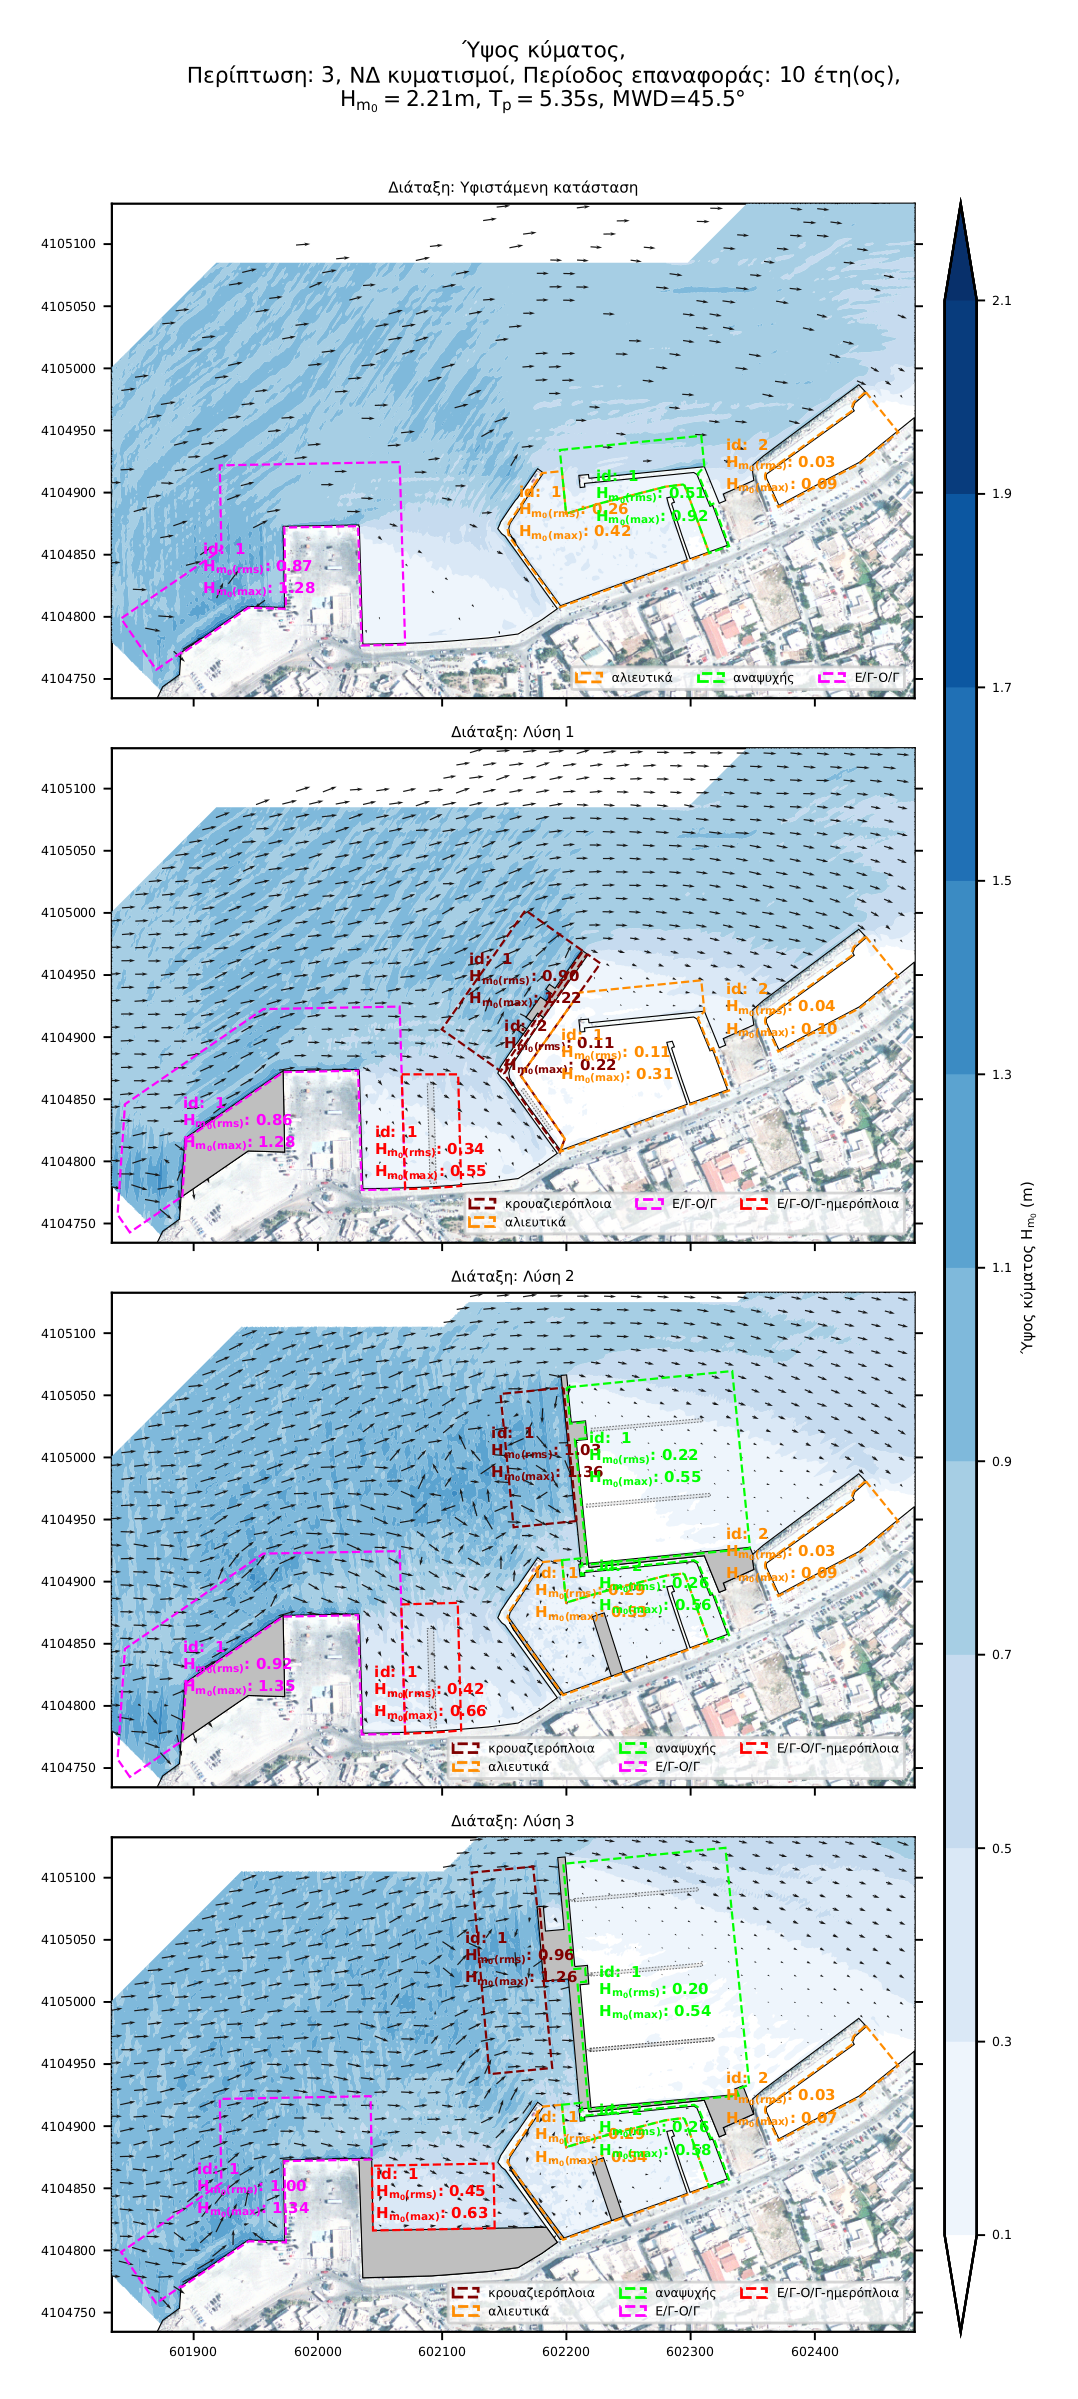
- 168 ARTEMIS simulations, for the calculation of wave disturbance, 21 for each sub-domain, 4 layouts (Existing layout, Alternatives 1, 2 and 3).
Results
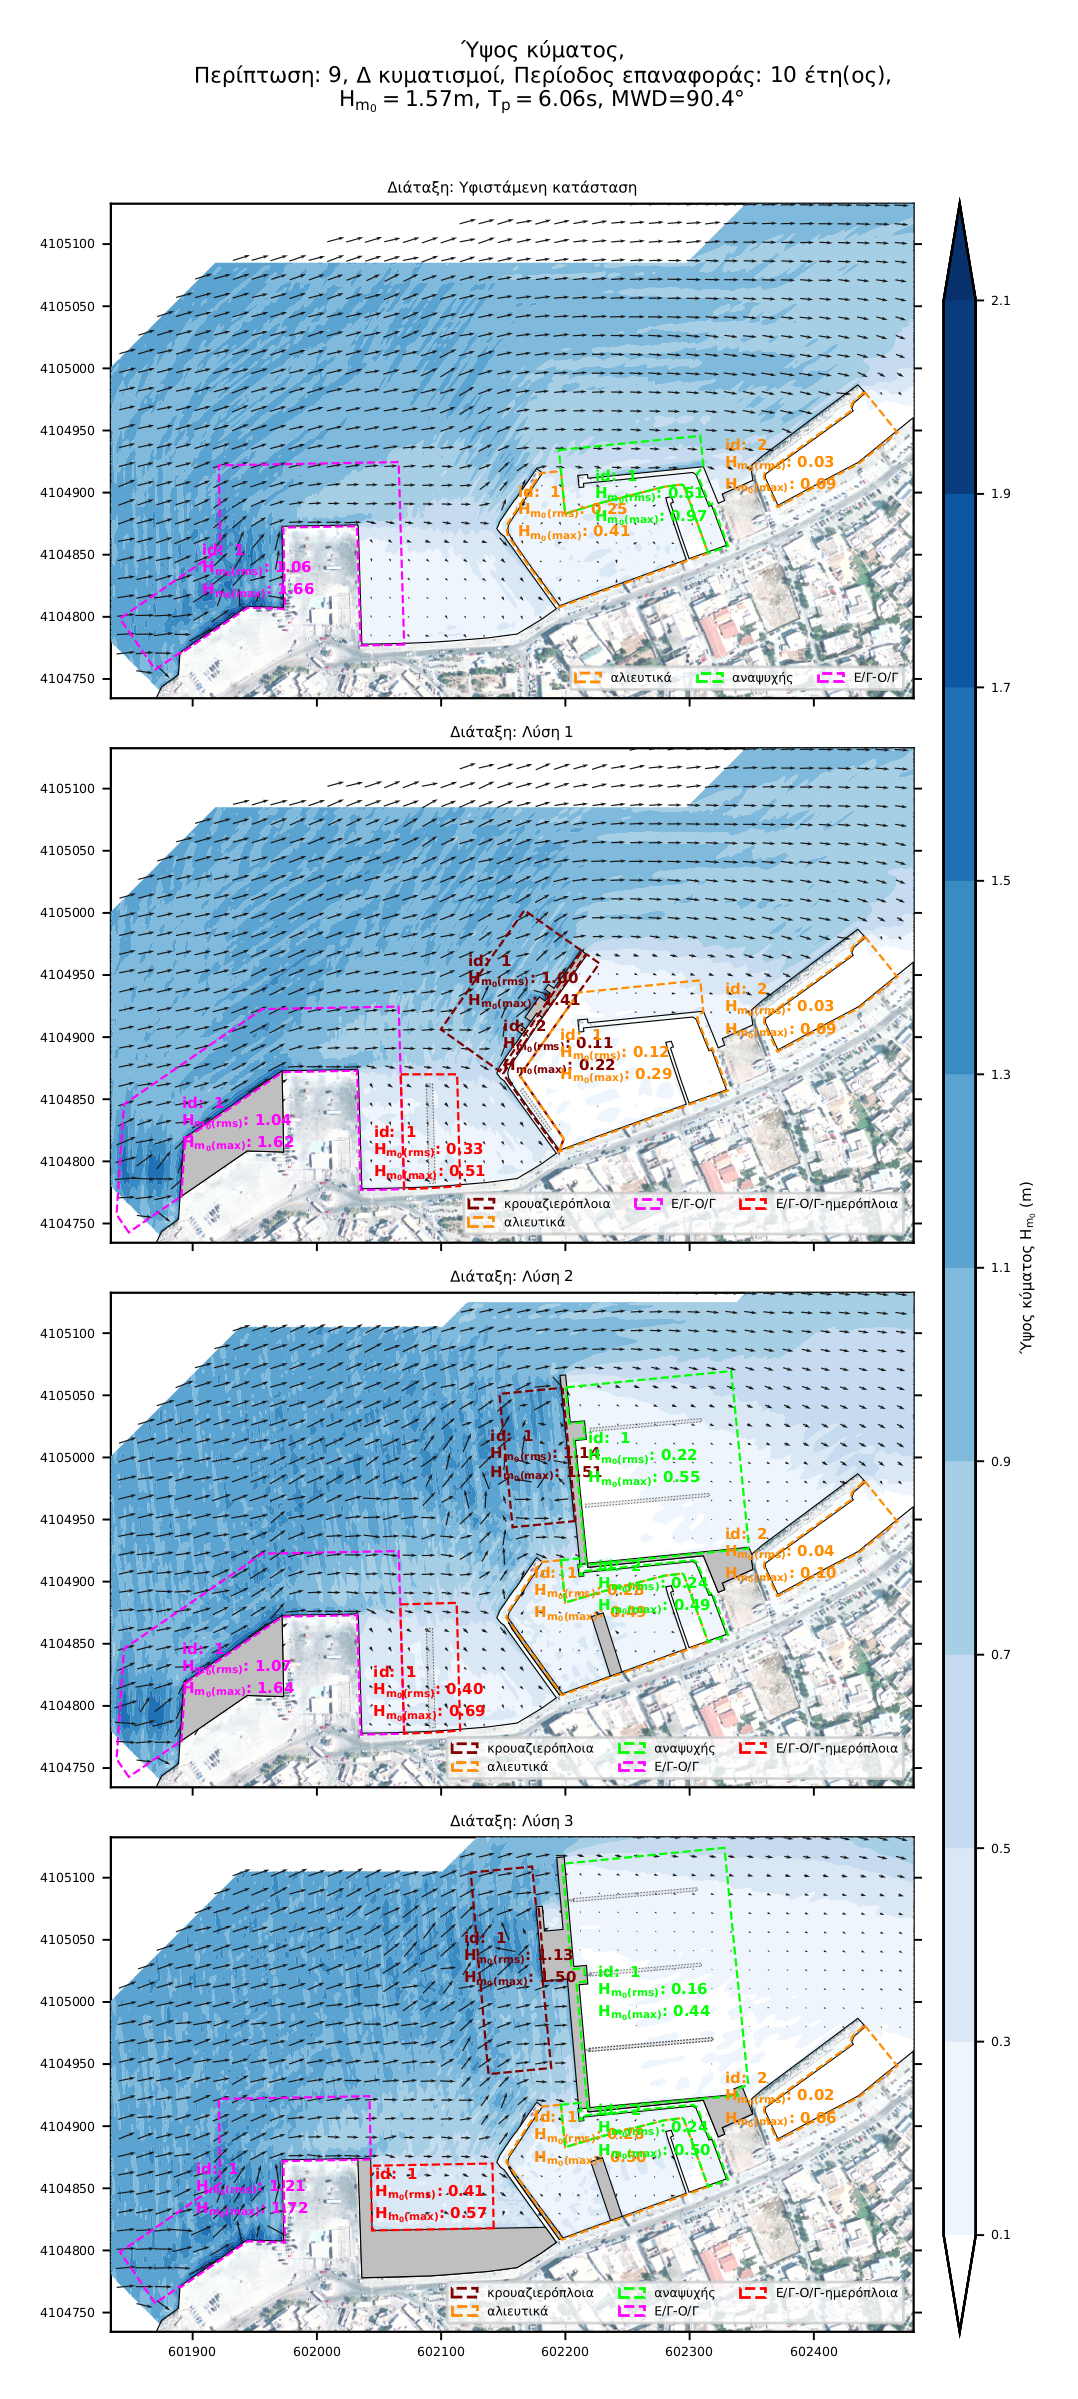
For further analysis and objective comparison of the results, areas of interest were defined for every layout. For each area, the following parameters were calculated:
- Active (Ηm0(rms)) and maximum wave height (Hm0(max)) for absolute disturbance and
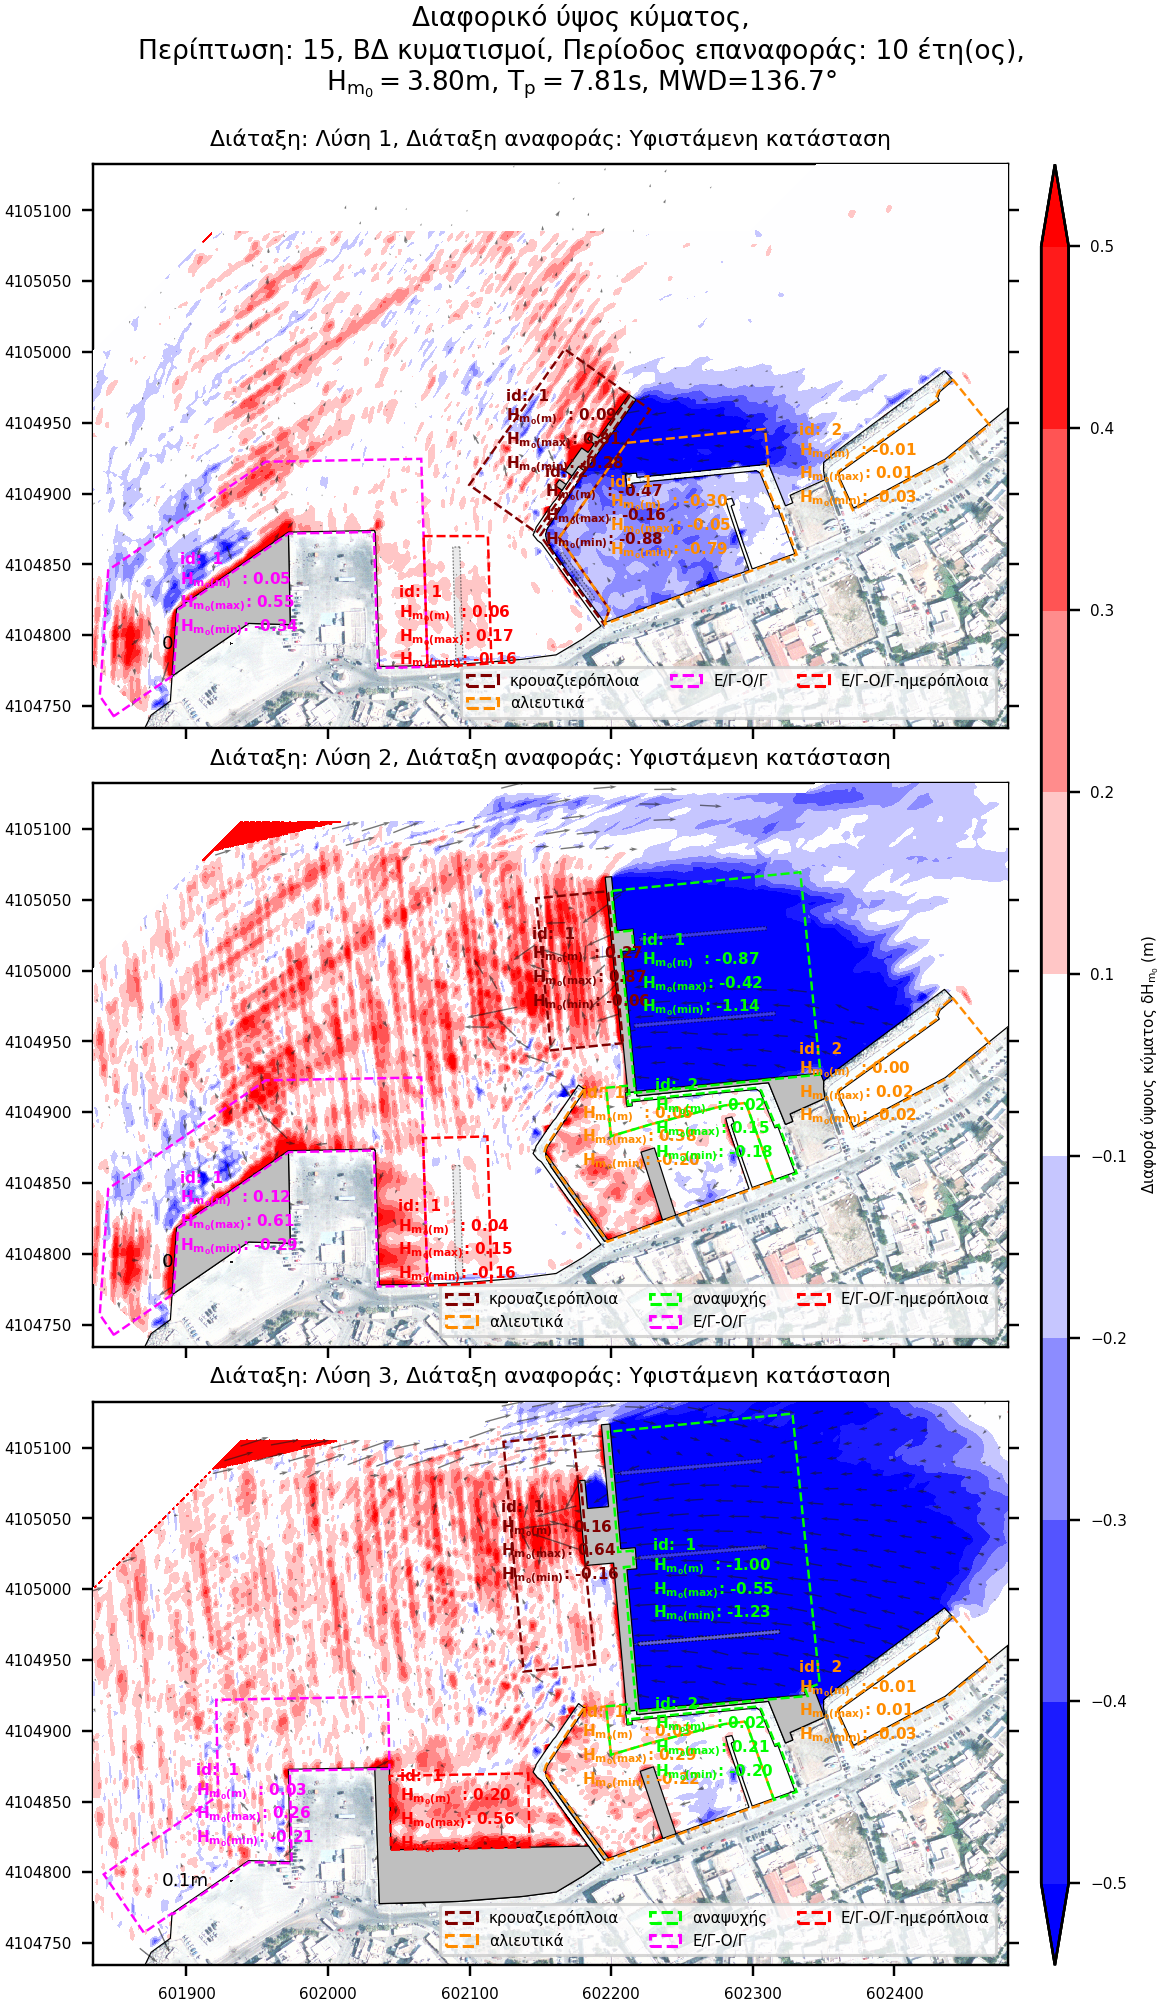
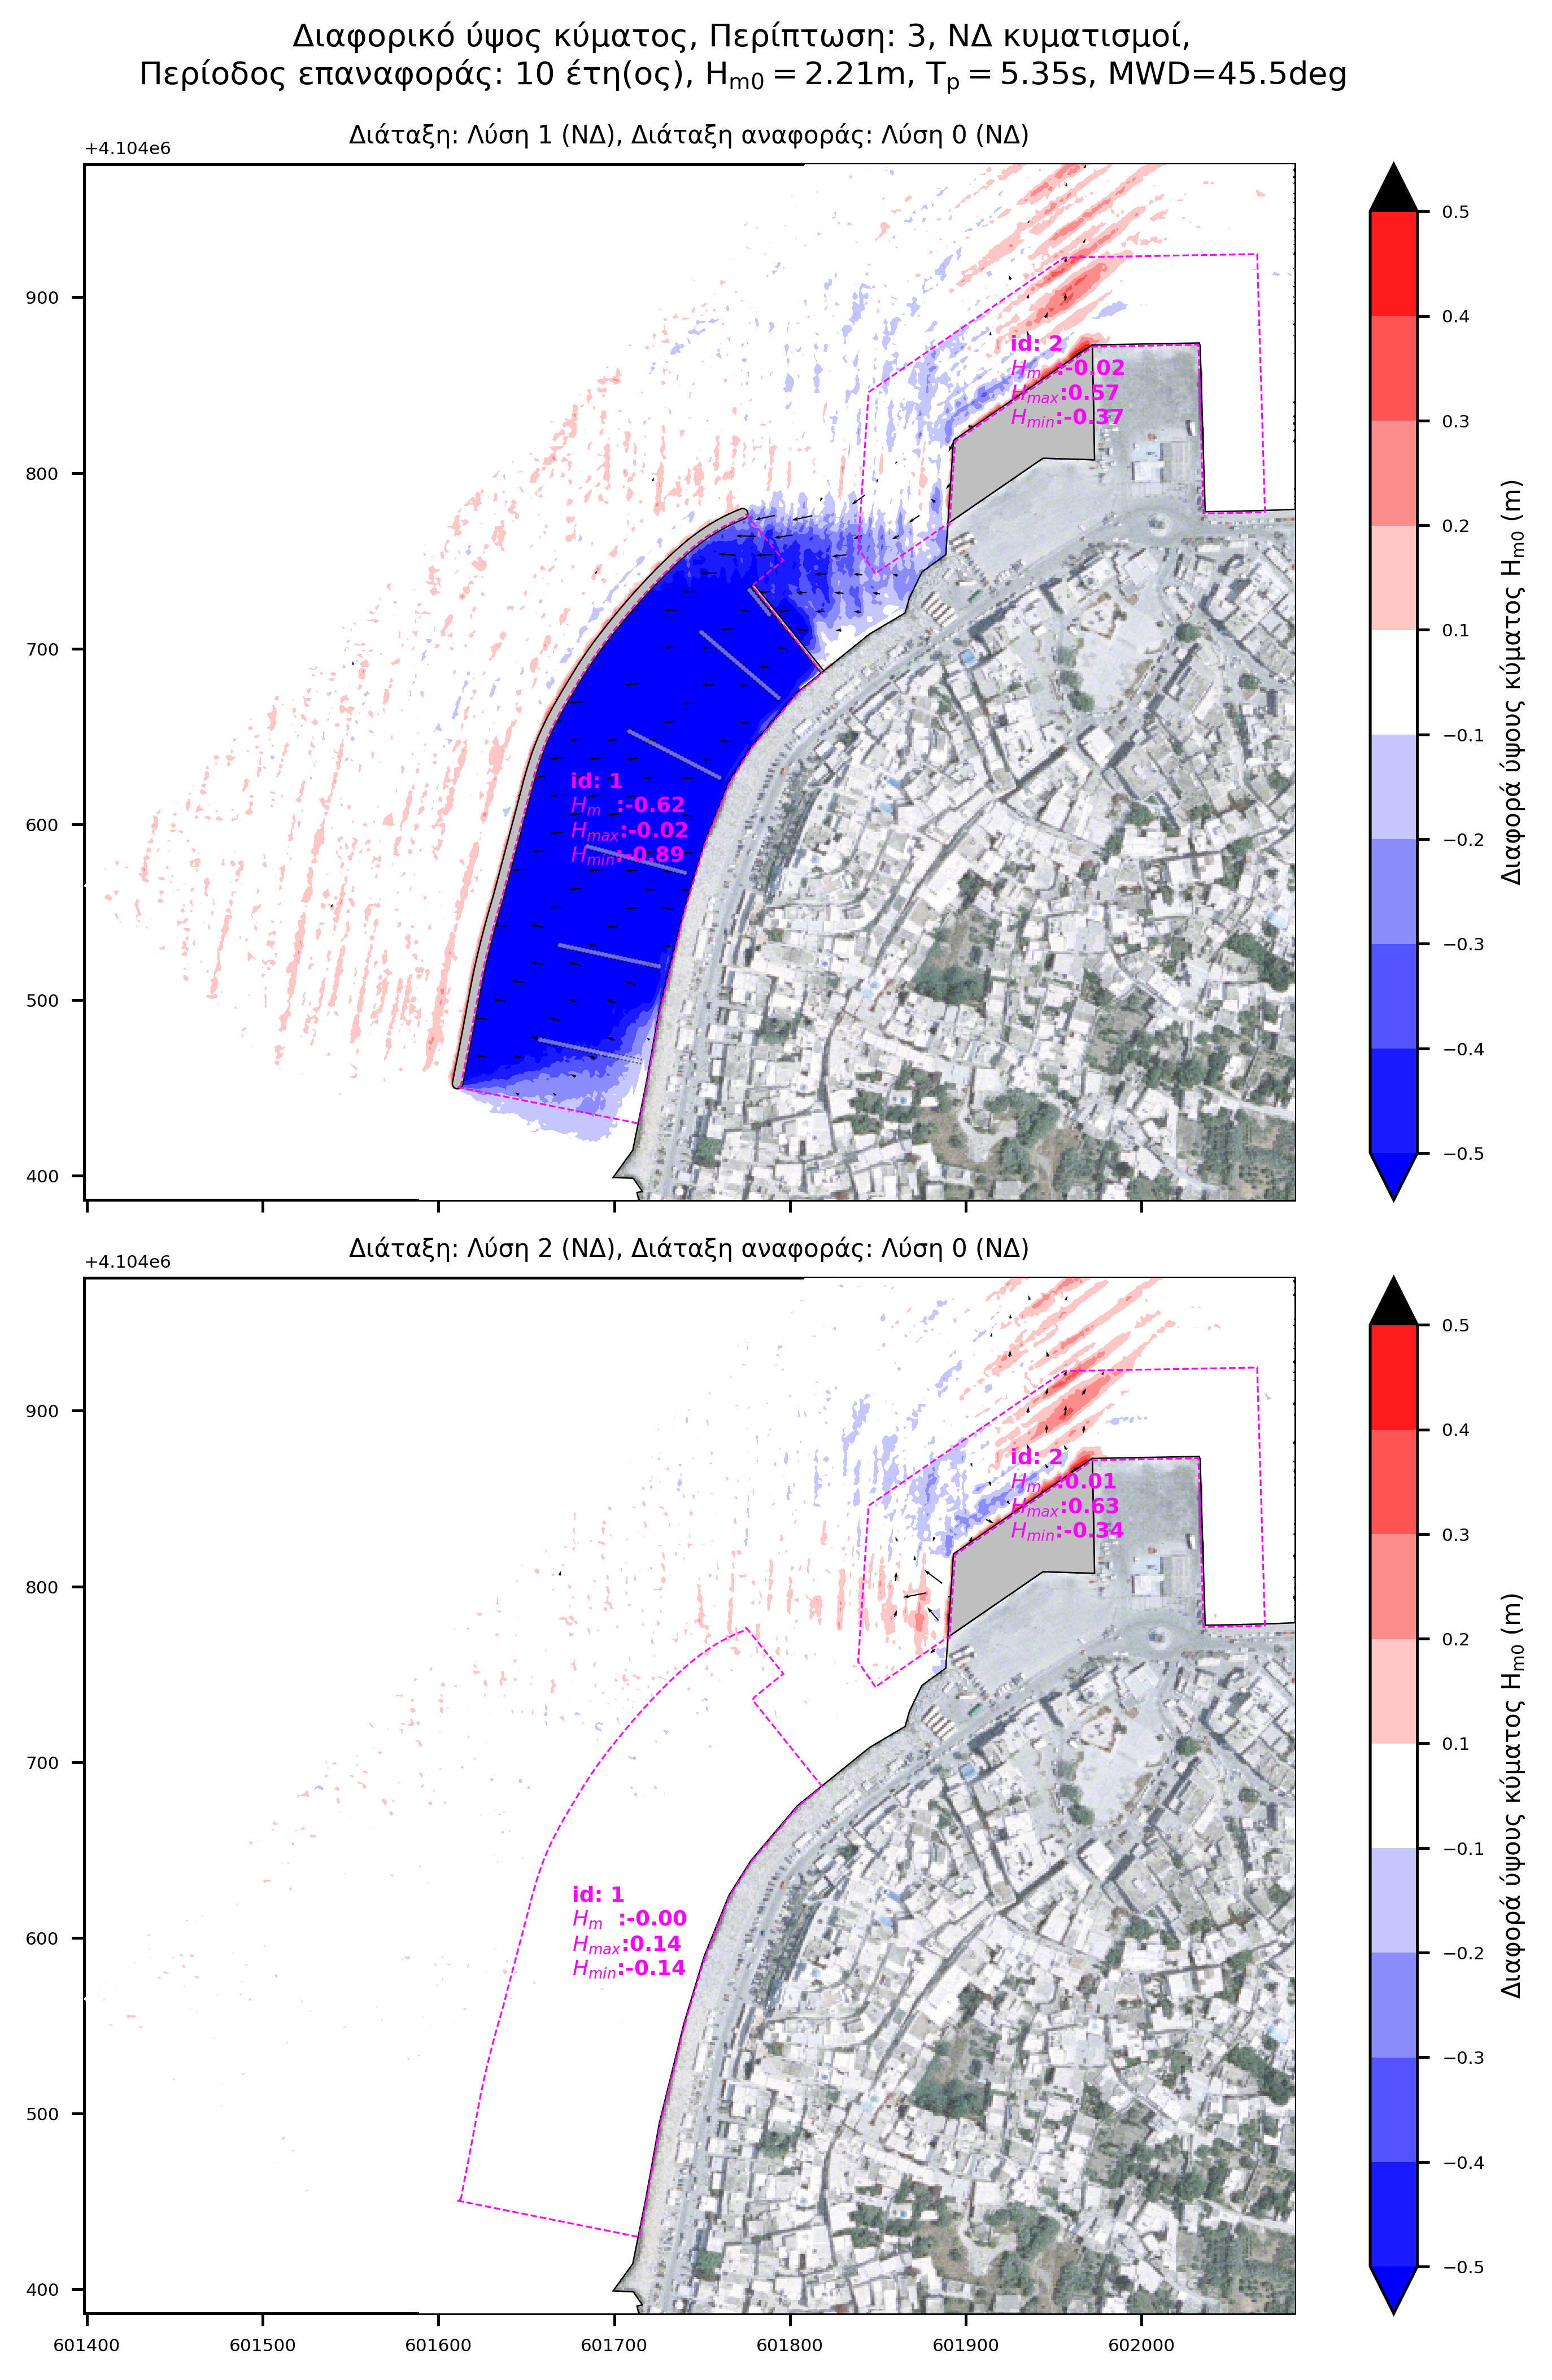
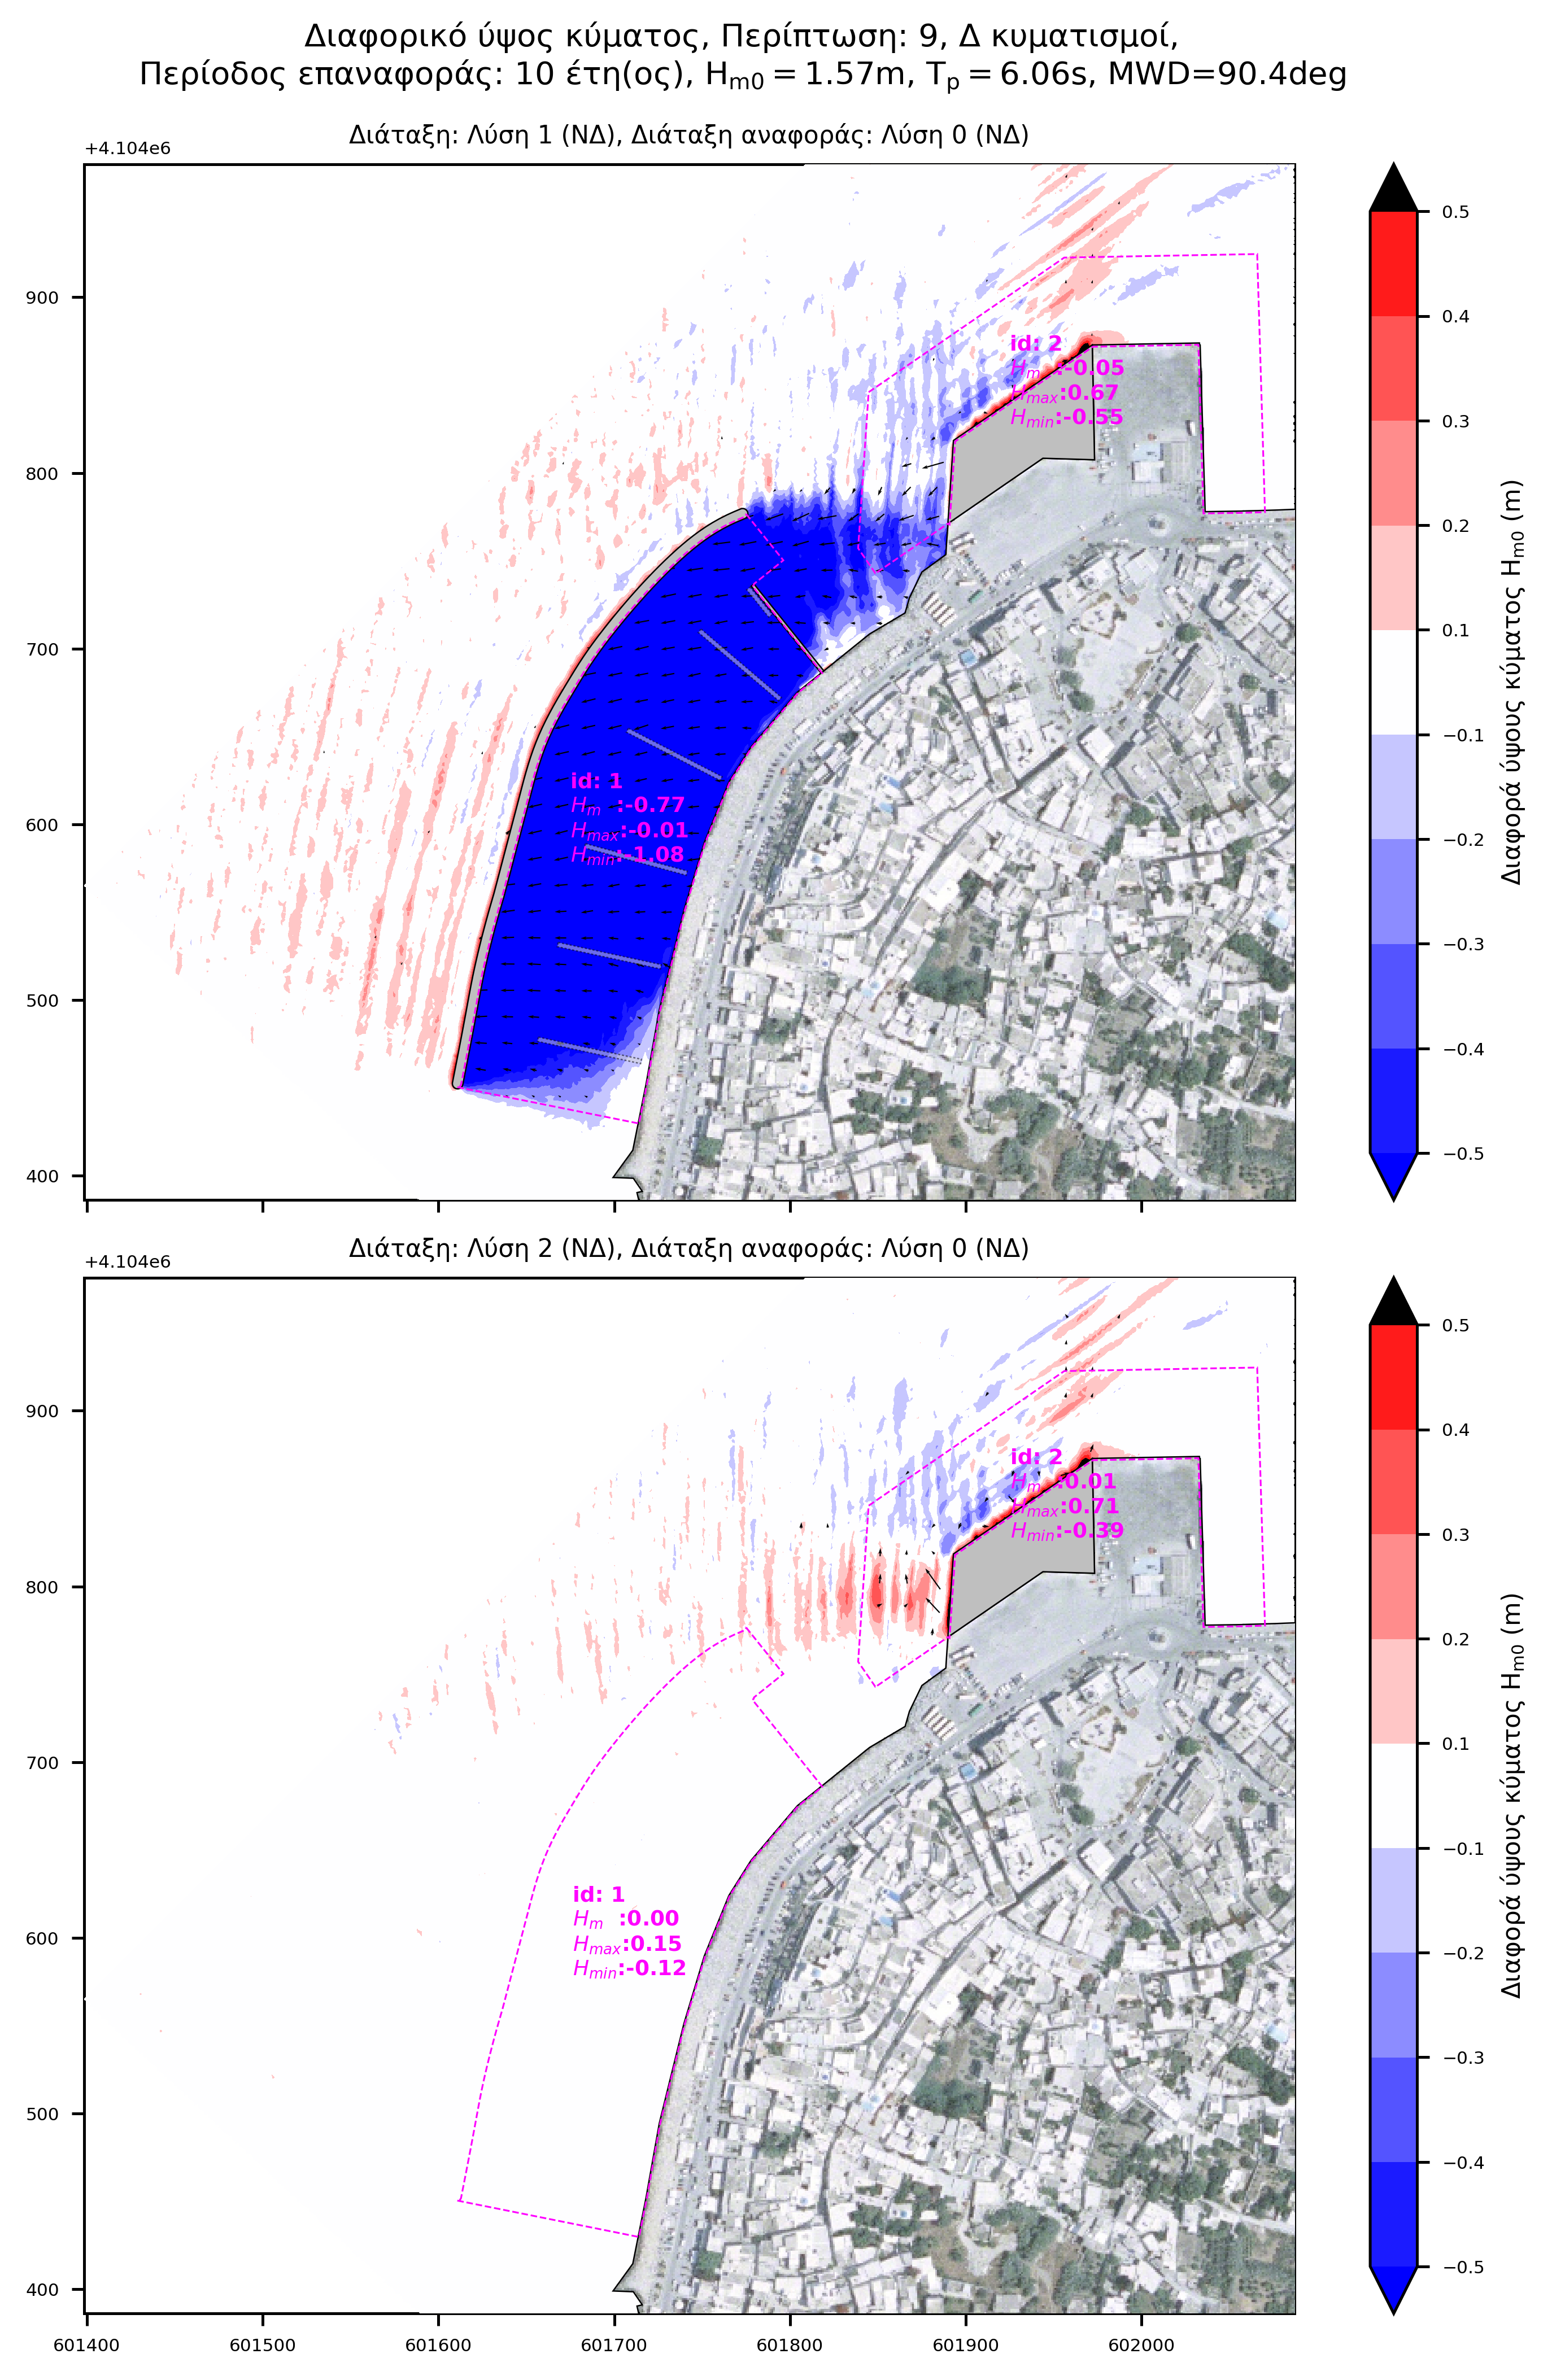
- Active (Ηm0(rms),), maximum (Hm0(max)) and minimum wave height (Hm0(min)) for differential disturbance
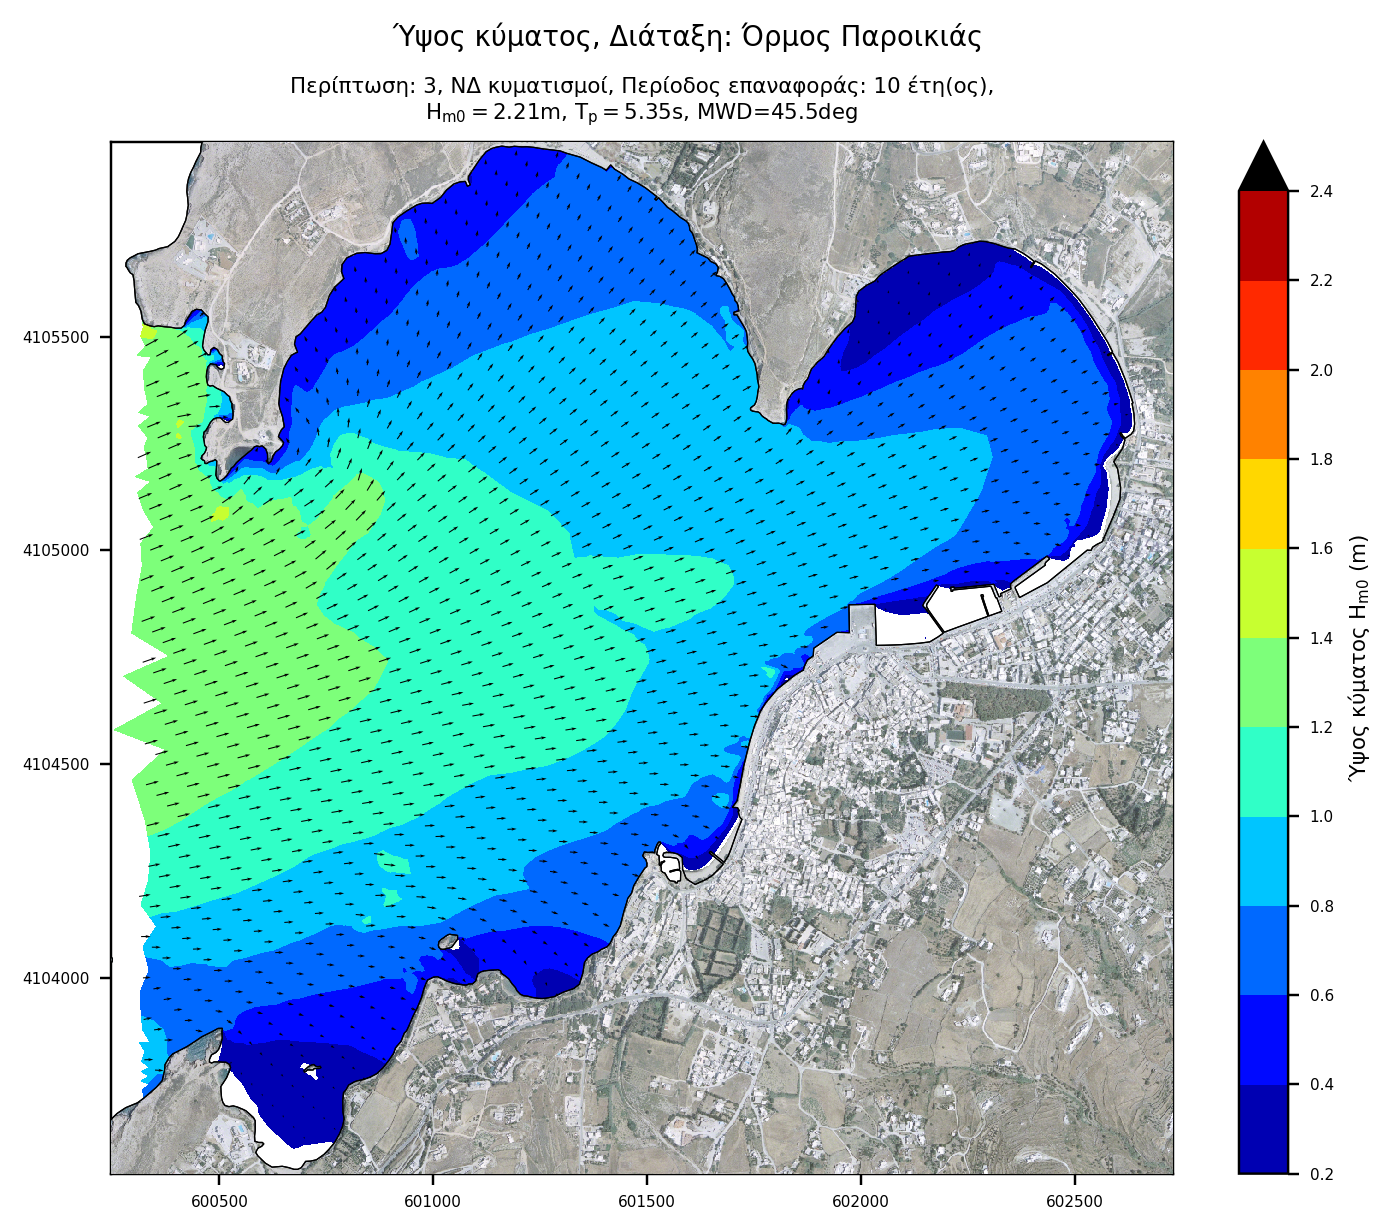
Absolute disturbance plots
Absolute wave disturbance plots show the results of each layout for each wave case, as derived from the simulation.

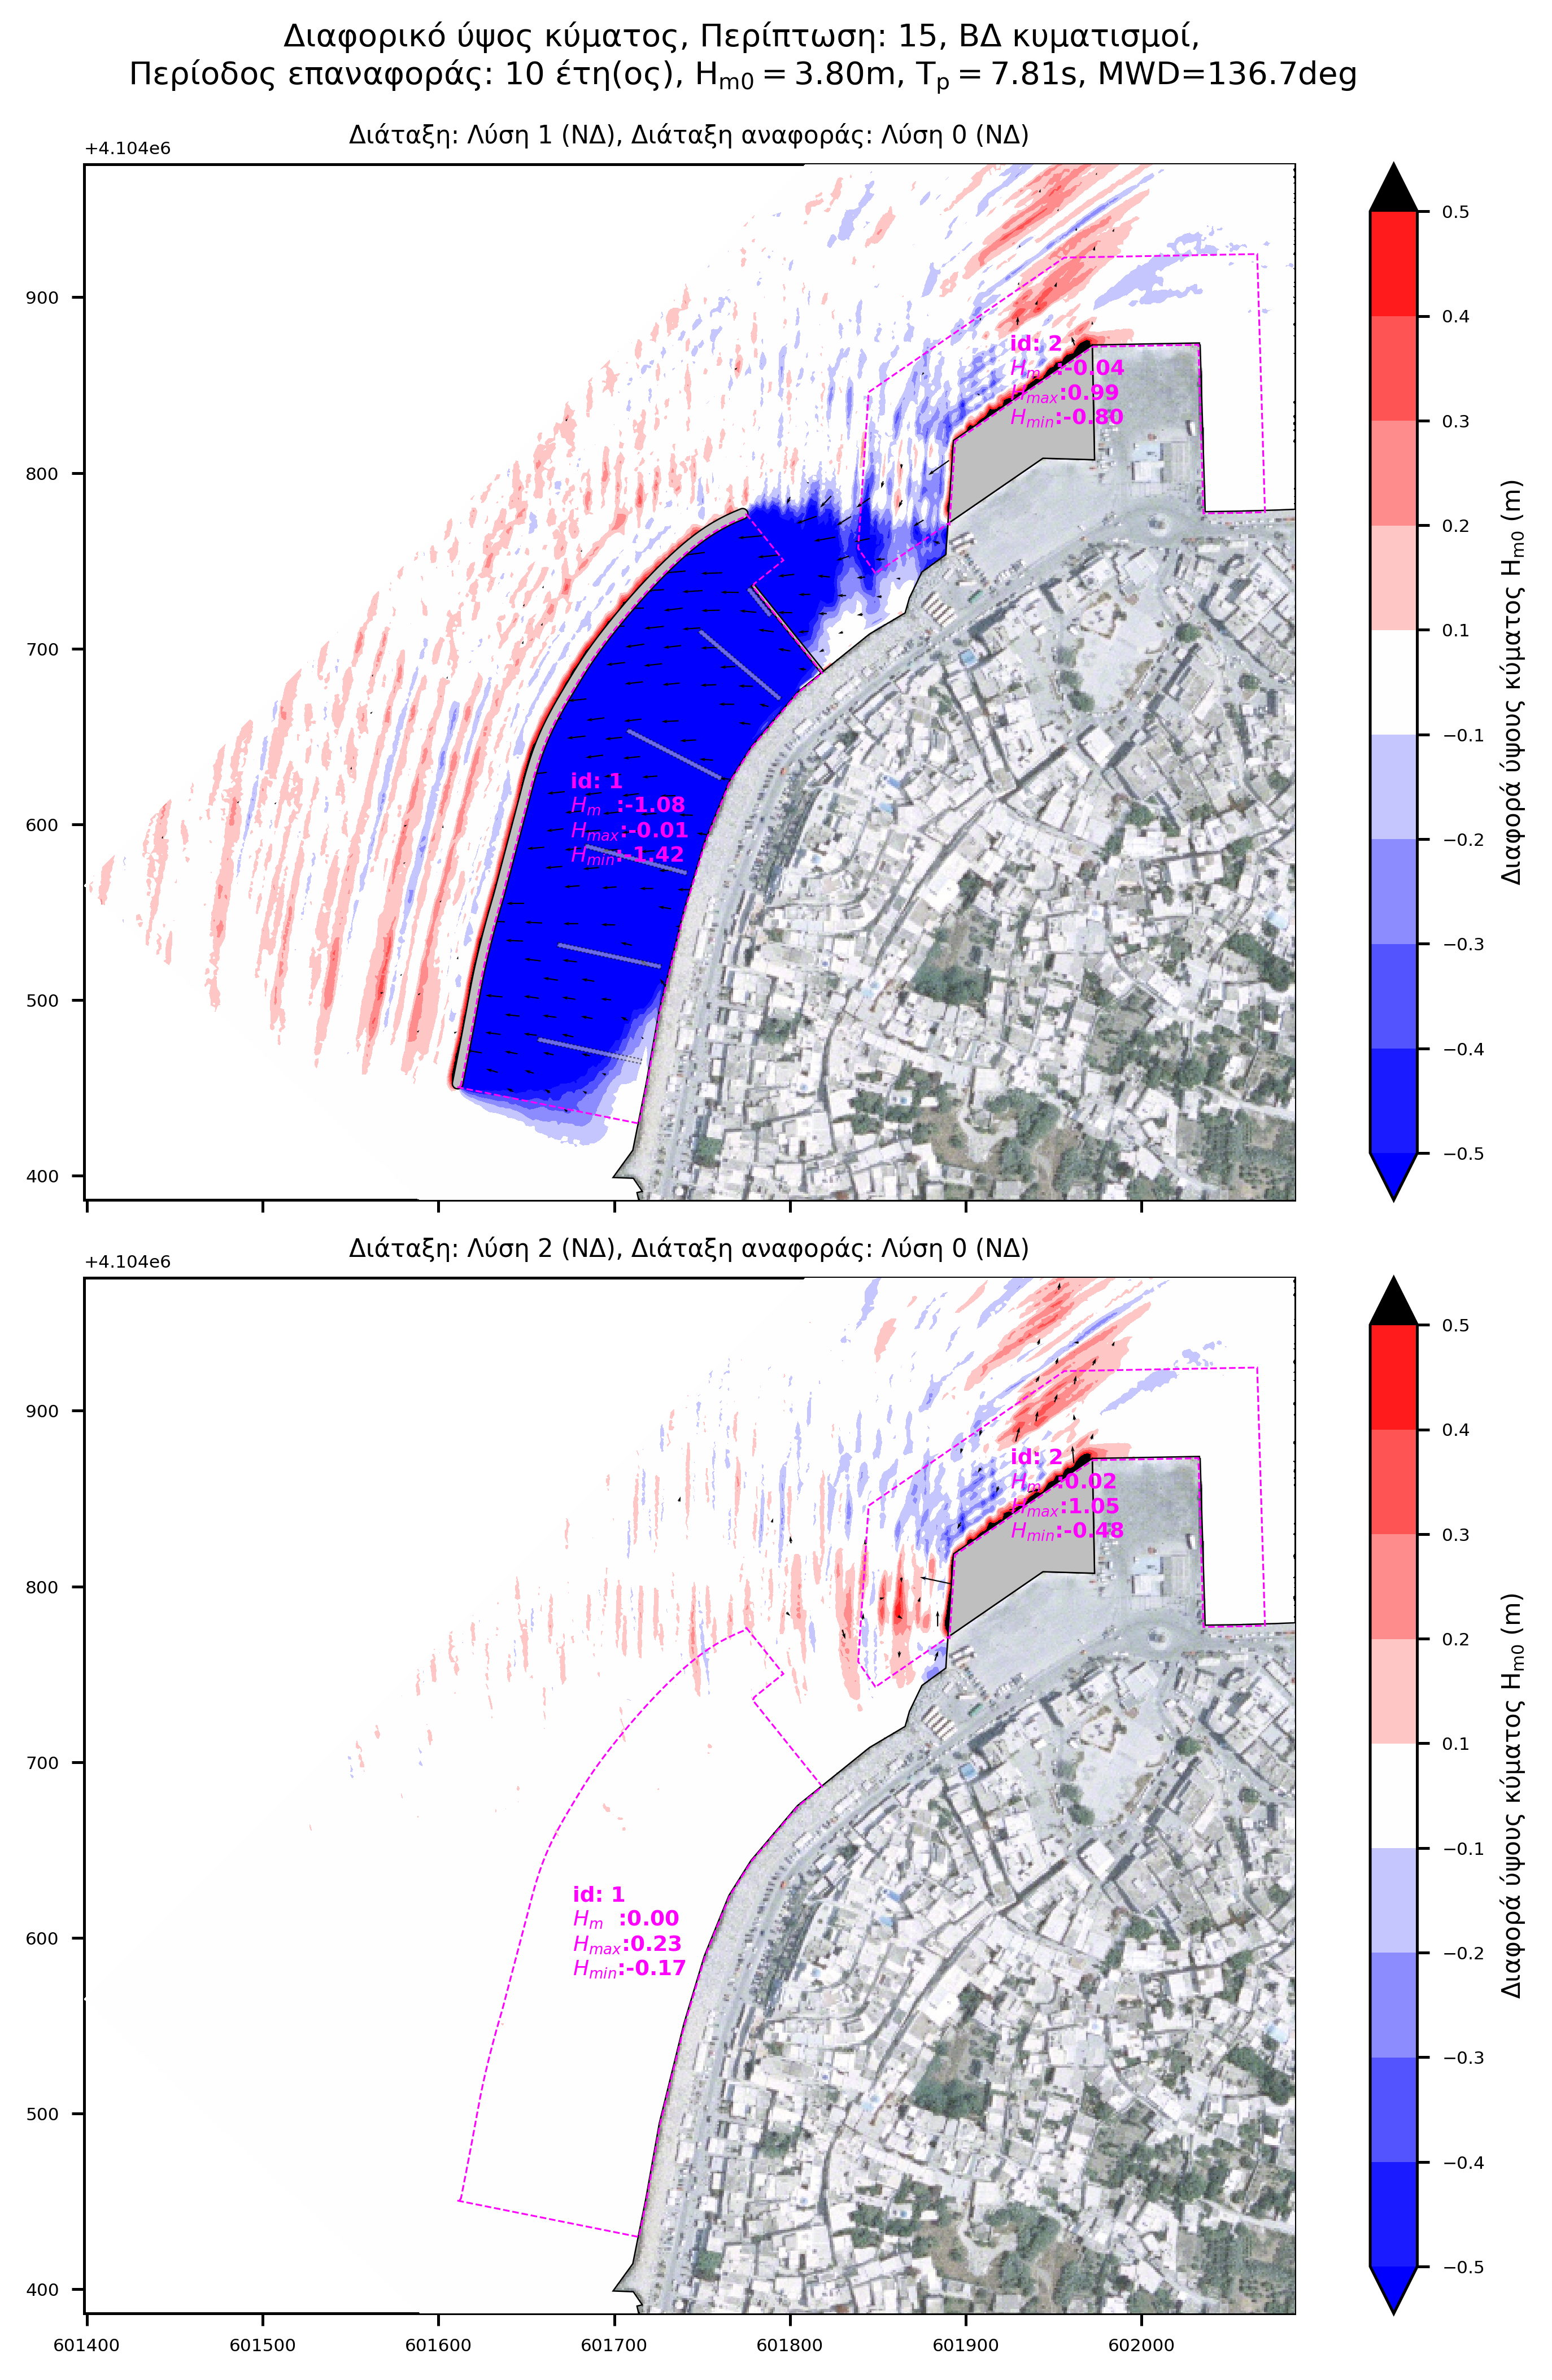
Differential disturbance plots
Differential wave disturbance plots result from the algebraic subtraction of the wave disturbance between the compared layouts. The "Reference Layout" disturbance is subtracted from the disturbance of the solution under consideration. Positive differential disturbance (red gradient), means the layout under consideration causes more disturbance than the reference layout whereas negative differential disturbance (blue gradient), means the layout under consideration causes less disturbance than the reference layout.
This easily identifies the positions as well as the extent to which each layout has an advantage / disadvantage over the "Reference layout". Below is an example of differential wave disturbance of alternative layouts with respect to the Existing layout.


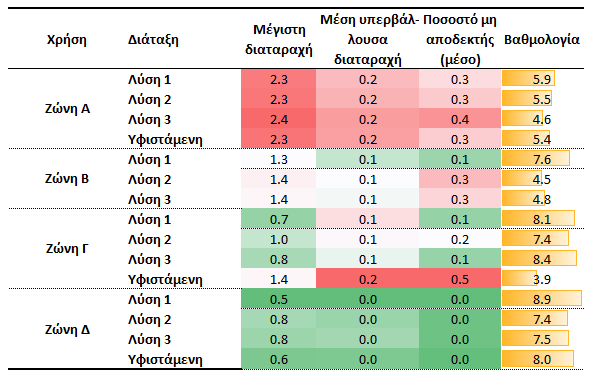
Quantitative evaluation
The score is calculated using an evaluation model that takes into account the following wave disturbance parameters for each zone:
- Maximum wave height (Hm0(max)),
- Wave height exceeding predefined limits of allowable disturbance (Hm0(exc)),
- Zonal percentage area exceeding predefined limits of allowable disturbance (PAexc).
Conclusion
Based on the results of the analysis it can be concluded that wave disturbance in the existing port layout is unfavorable, mainly due to increased wave exposure in the zone intended for recreational vessels (Zone C). The alternative layouts were specifically designed to address this issue and hence all alternatives are superior to the existing arrangement in this regard.
Overall, Alternative 1 received the highest score and hence it is considered the optimum from a wave disturbance standpoint.