Wave disturbance study for the Karkinagri fishing port expansion
The wave disturbance study is supporting the project entitled "Technical studies for the extension of the fishing port of Karkinagri, Ikaria", assigned to CNWAY in May 2010.
Scope
The scope of the study is to investigate the wave disturbance of the alternative layouts (as defined in the preliminary study). The assessment is made in comparison with the current situation and aims to verify that the proposed mooring facilities are acceptable in terms of wave conditions.
Alternative layouts
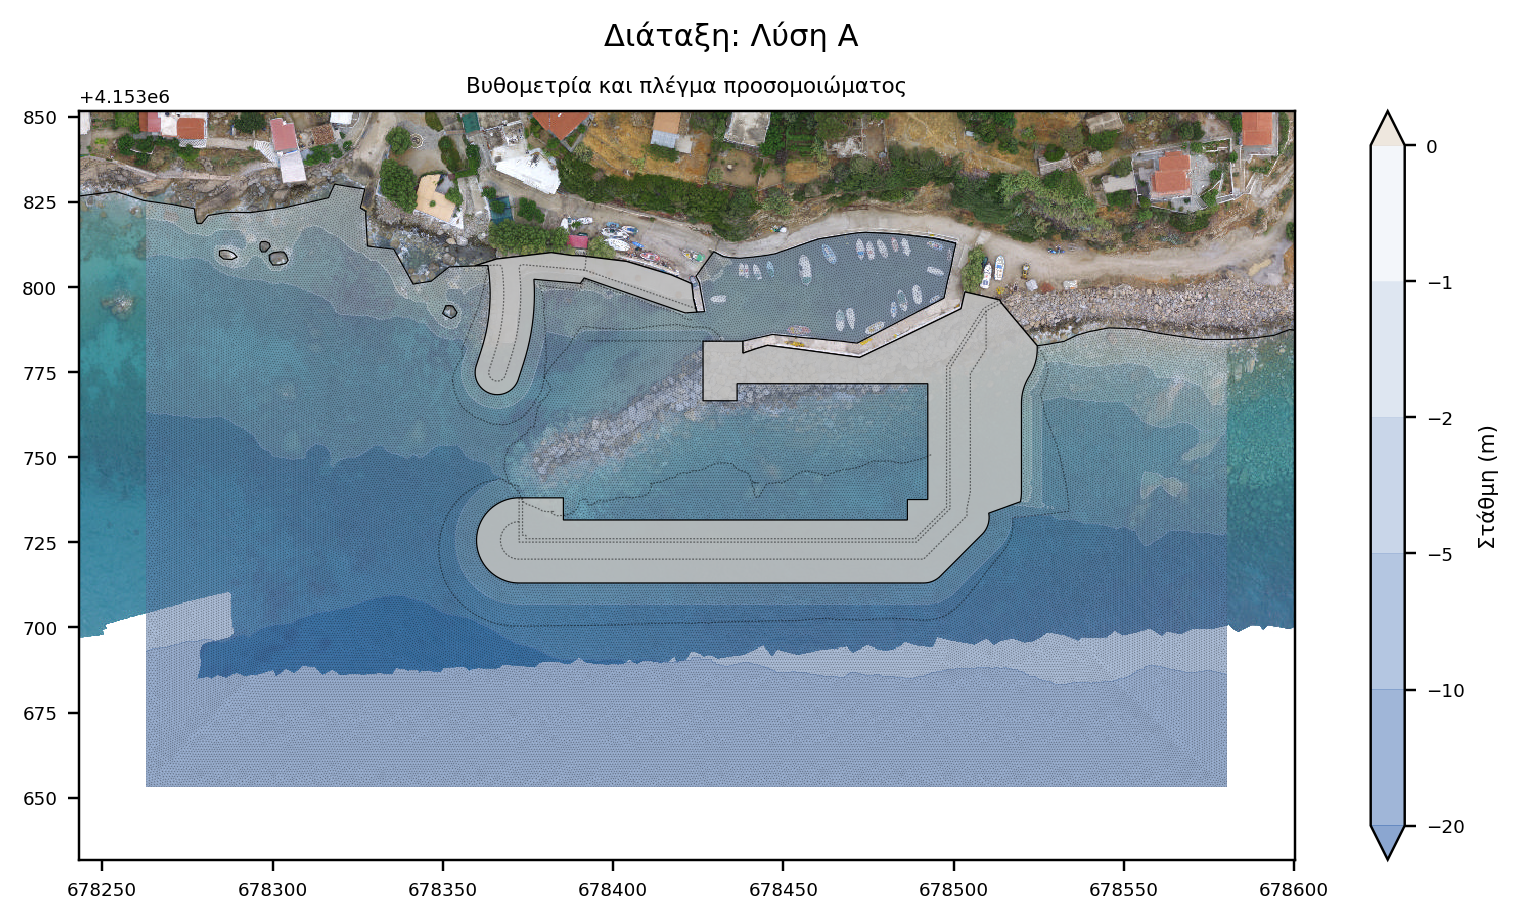
Alternative layouts B, C and D have the same opening orientation and similar layout of exterior works. Therefore, the most prevalent alternatives are examined, as proposed by the Preliminary study, ie Layouts A and B.
Numerical modeling
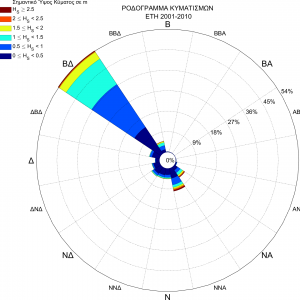
Wave climate
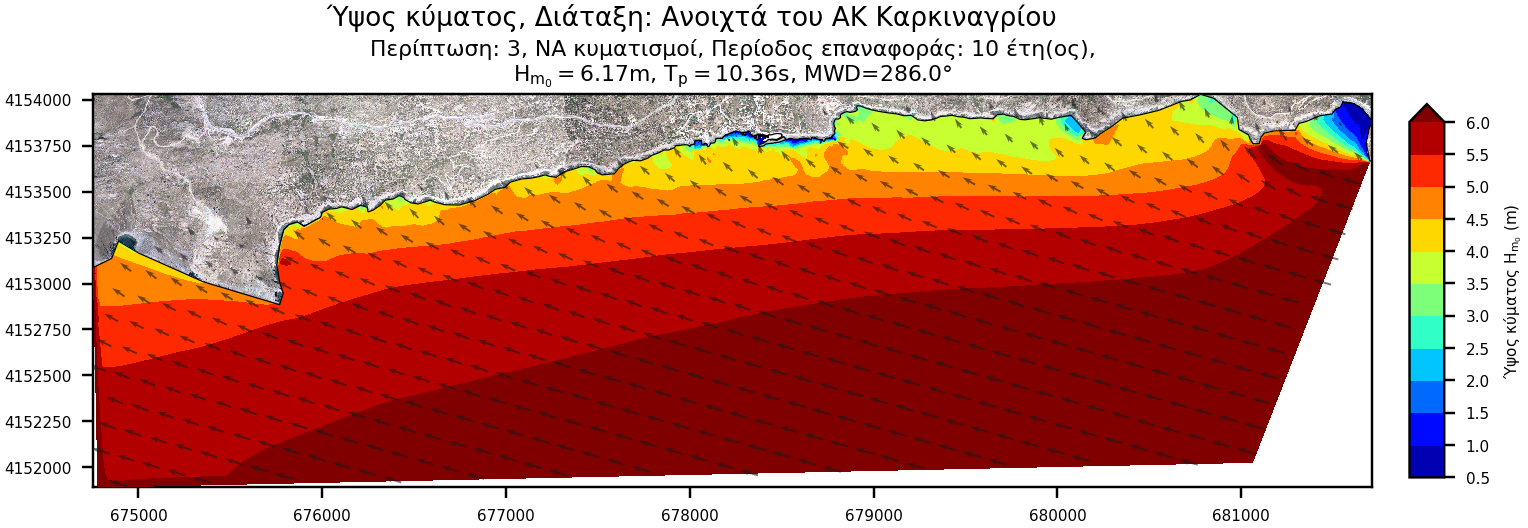
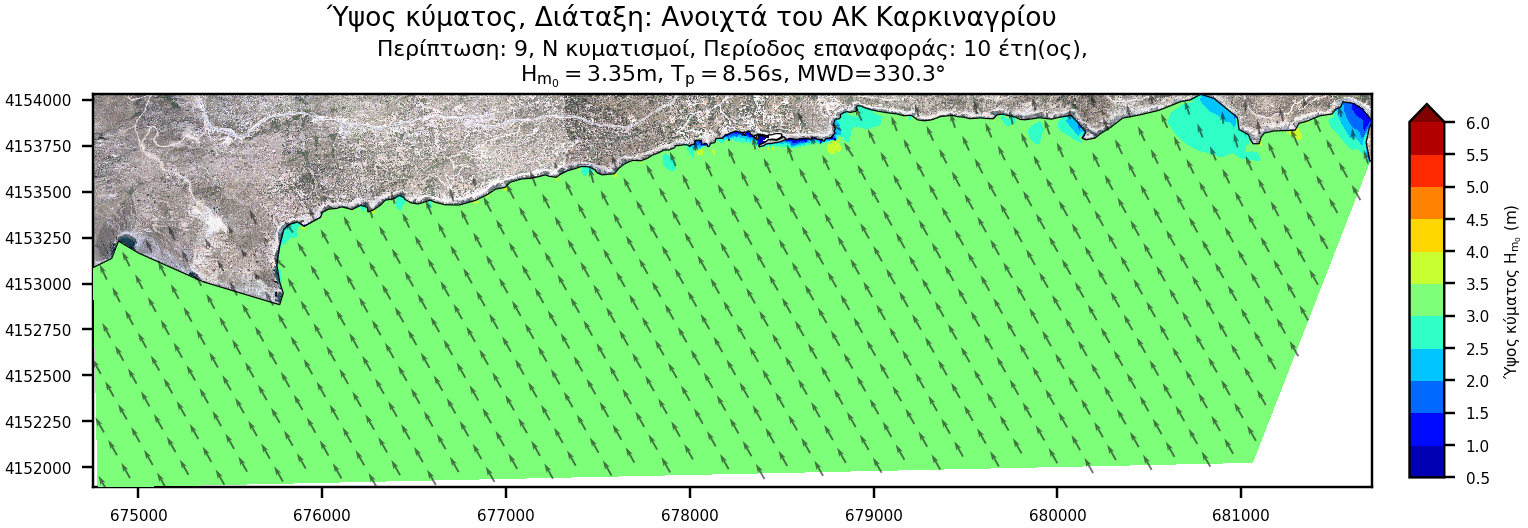
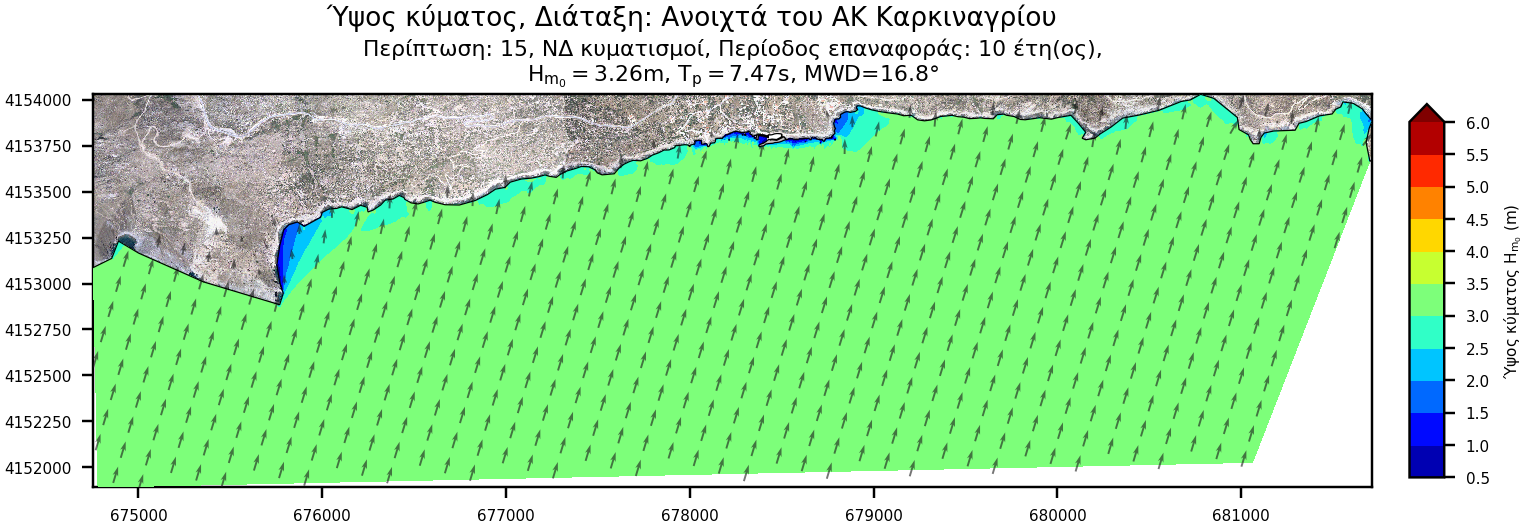
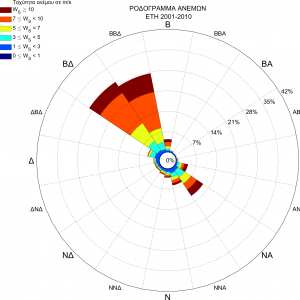
Wave and wind data are derived from the WAMC4 and Skiron/Eta forecast model from node 921_231 with latitude and longitude 36.50o, 26.00o respectively. The node is located 2,5 kilometers away from the project site. The duration of the data covers the period between 2001 and 2010.
Model characteristics
The simulation is usually performed by employing two separate models, the offshore and the wave disturbance model. The former extends from the position of offshore wave conditions (a node of the regional WAM wave model) up to the shore, and its role is to define the boundary conditions for the wave disturbance model.
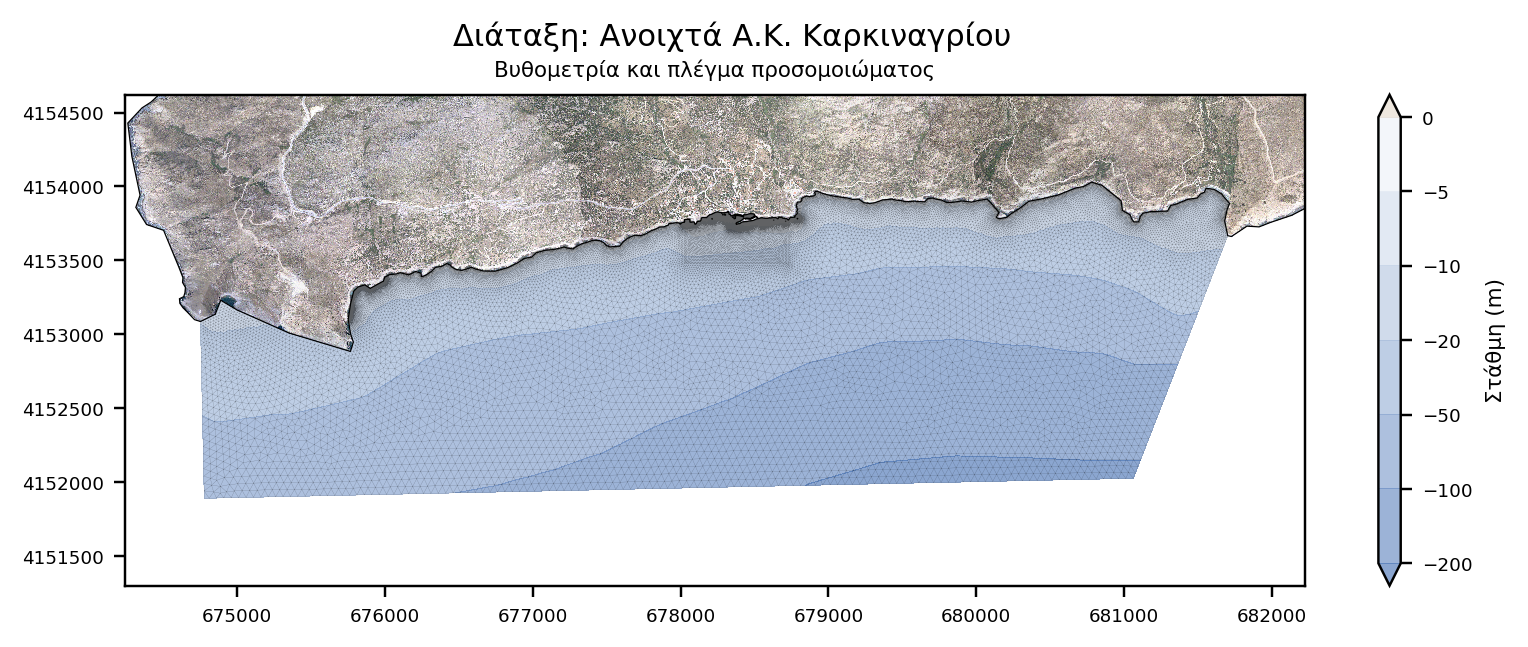
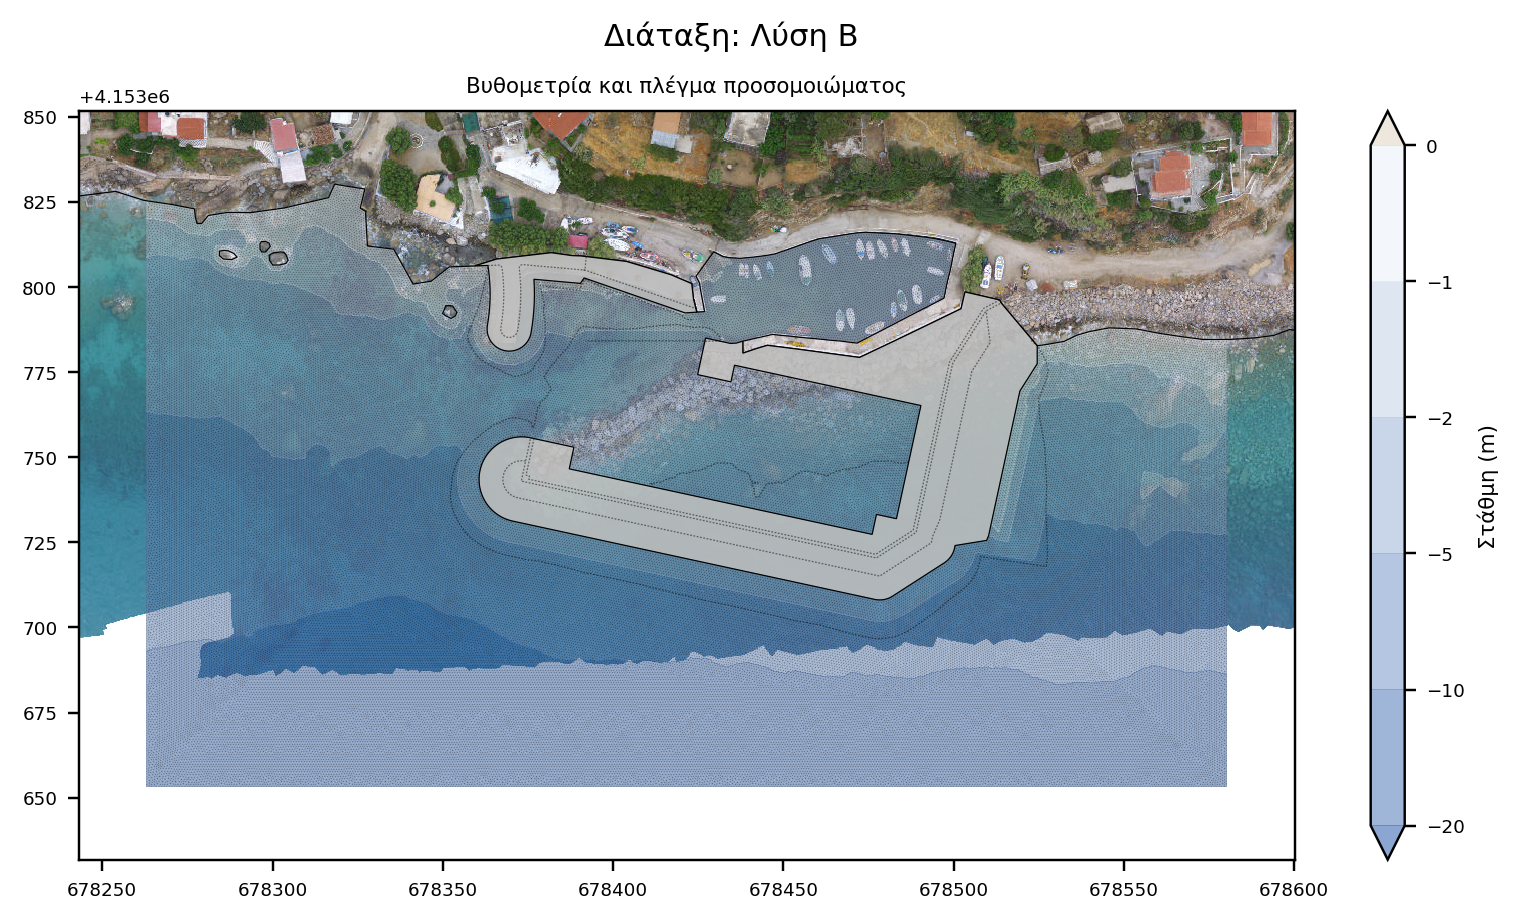
- Offshore model: It extends 7,0 km along the E-W-axis and 2,0 km laterally. It covers an area of approximately 11,1 km2 and consists of 109.000 elements and 56.000 nodes
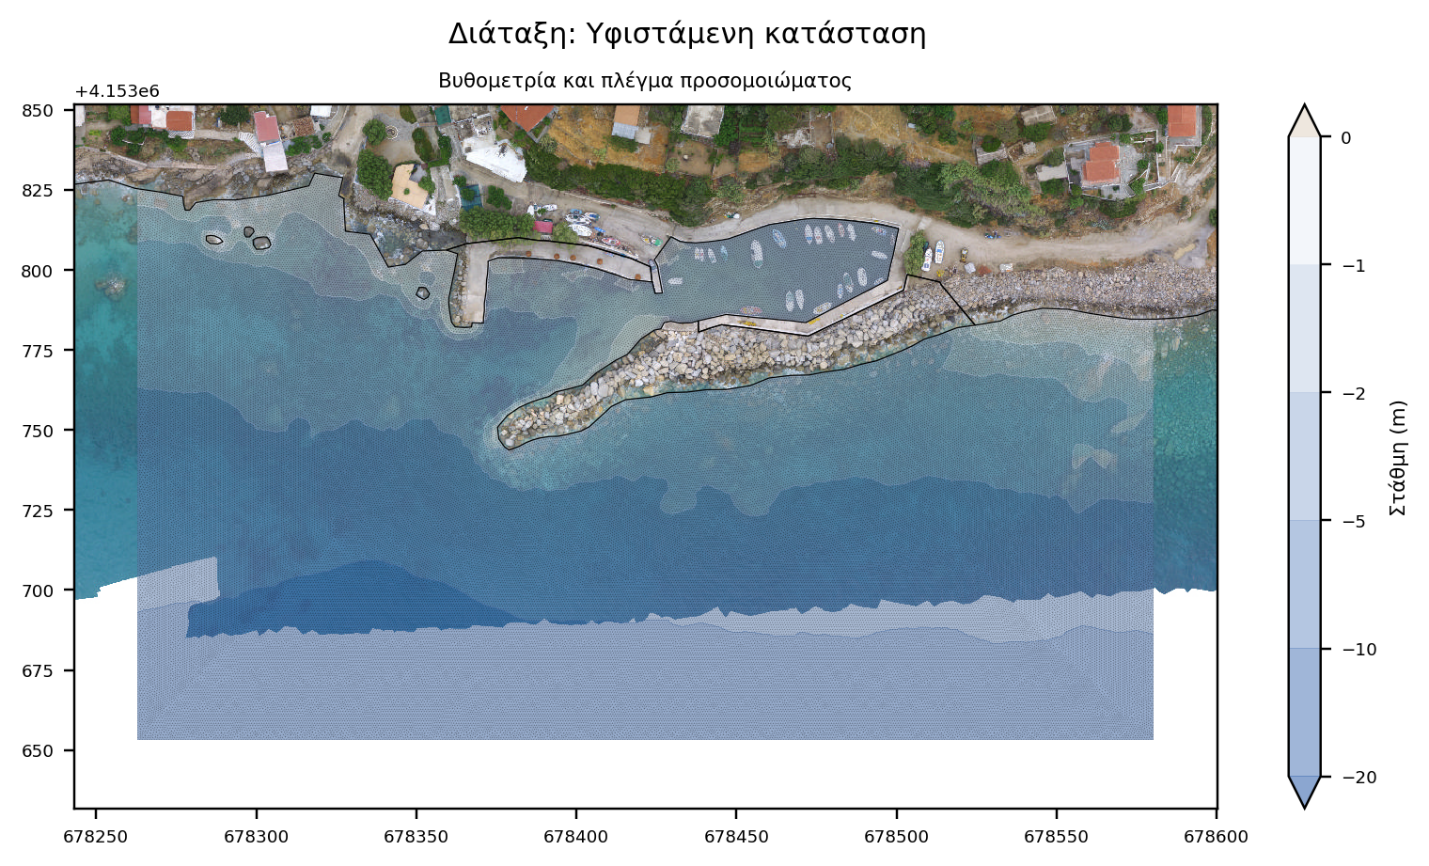
- Wave disturbance model: It extends 320 meters along the E-W axis and 170 meters laterally. It covers an area of about 11,4 acres and consists of about 159,000 elements and 80,000 nodes.
A total of 22 wave cases corresponding to 66 simulations were executed, which consist of:
- 21 TOMAWAC simulations to propagate wave conditions from the WAMC4 regional model node to the project location,
- 63 ARTEMIS simulations, for the calculation of wave disturbance, 21 for every wave case, 3 layouts (Existing layout, Layouts A and B).
Results
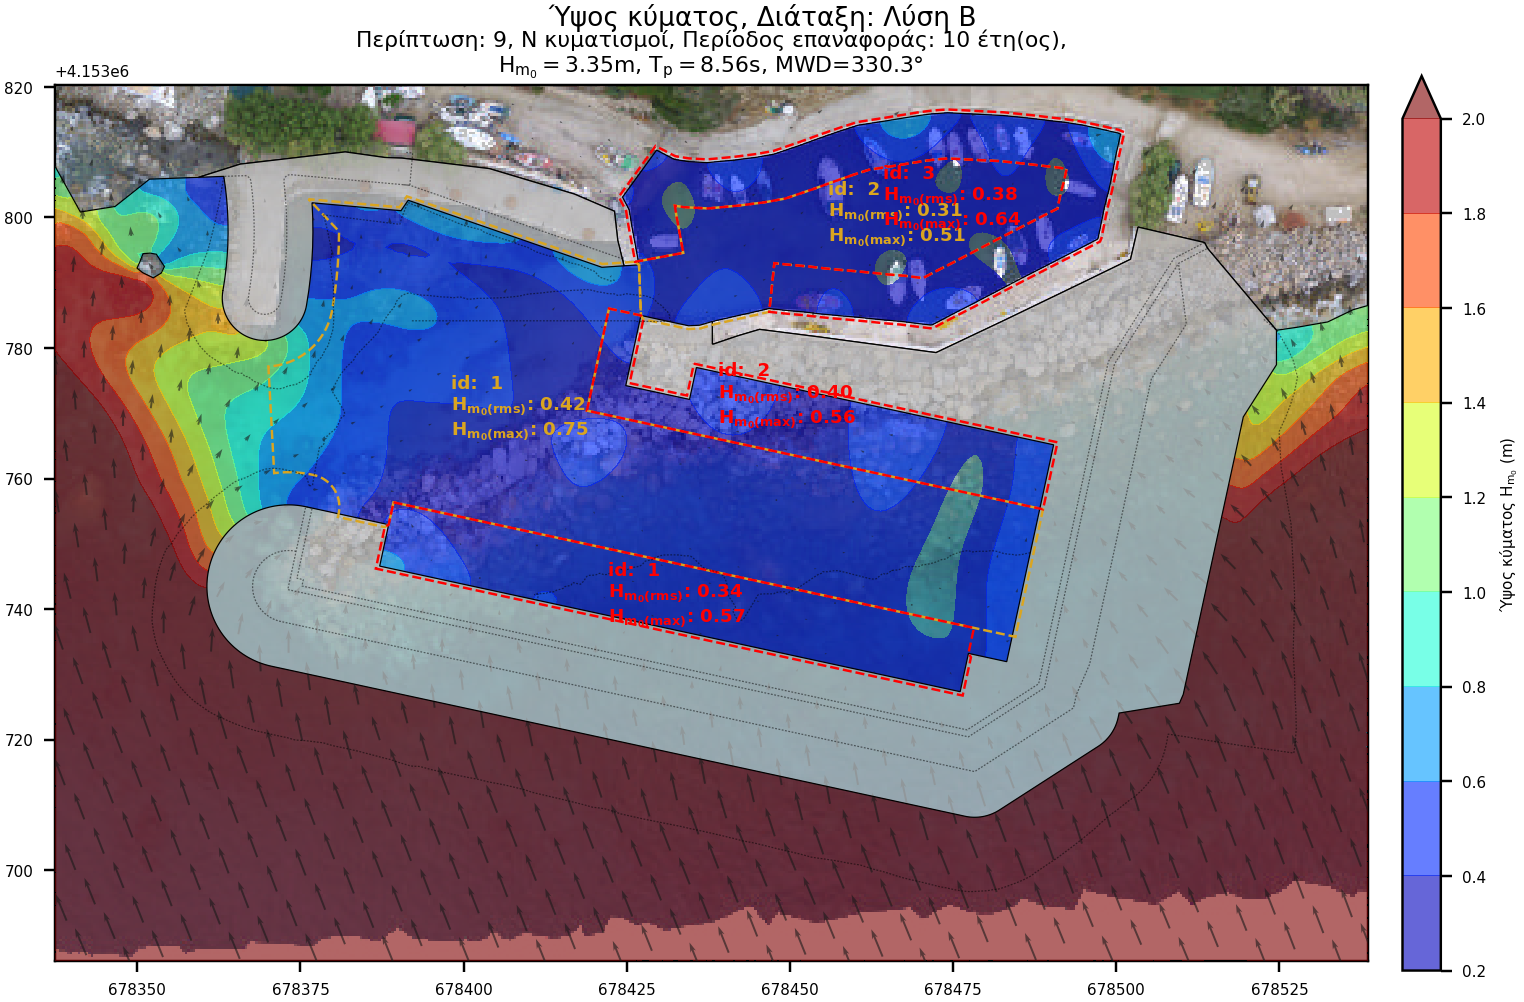
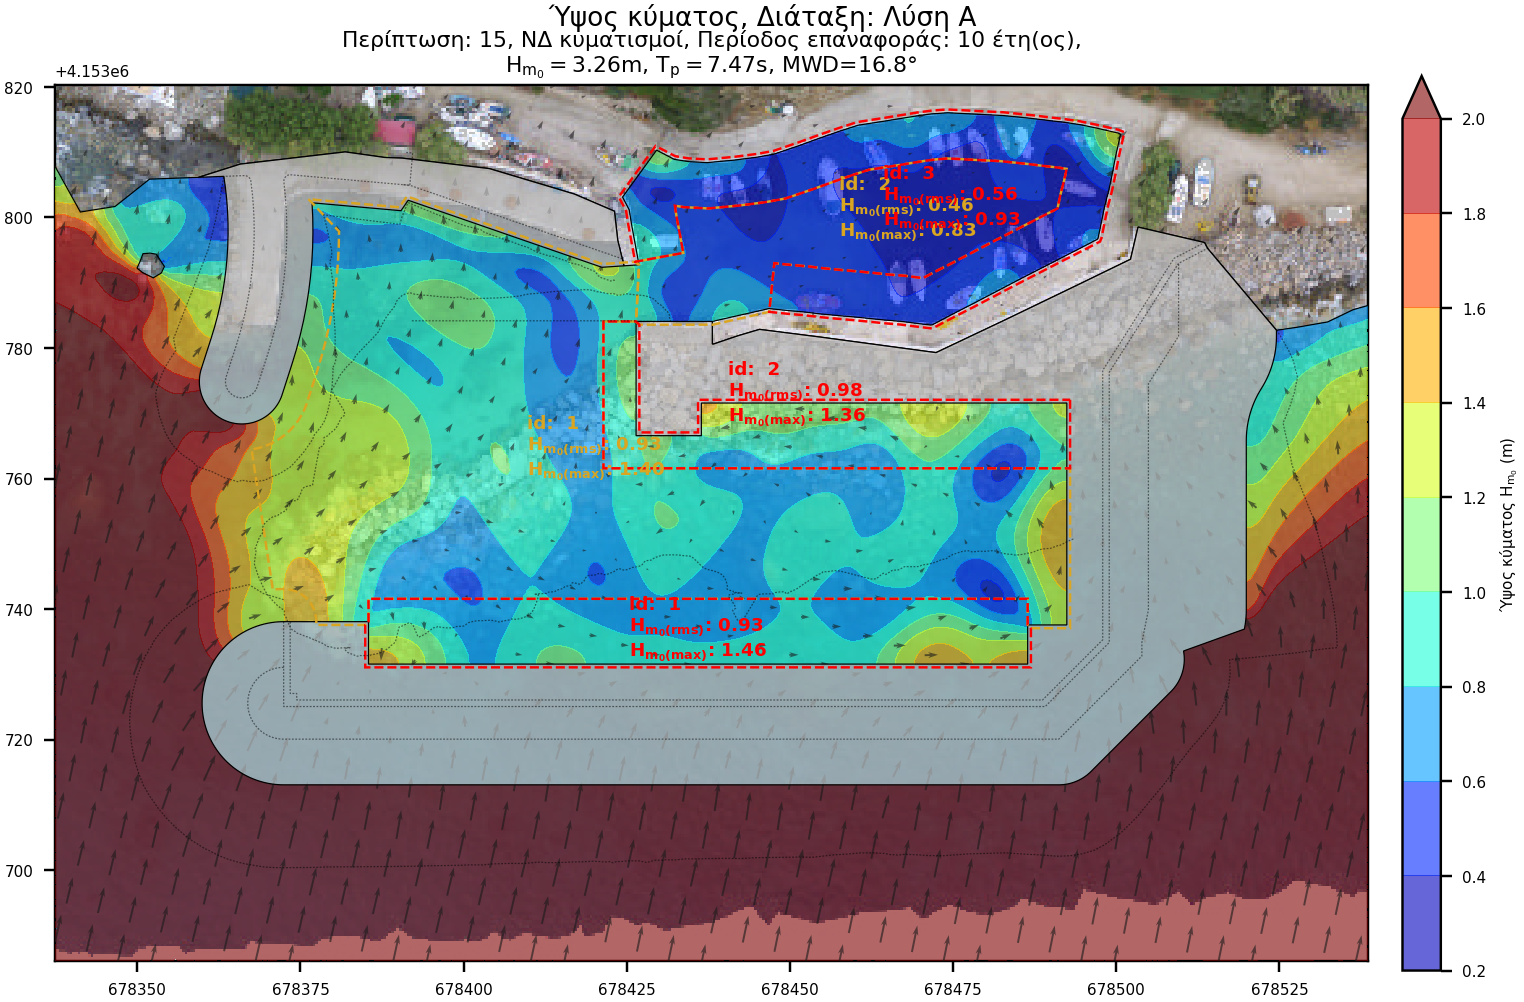
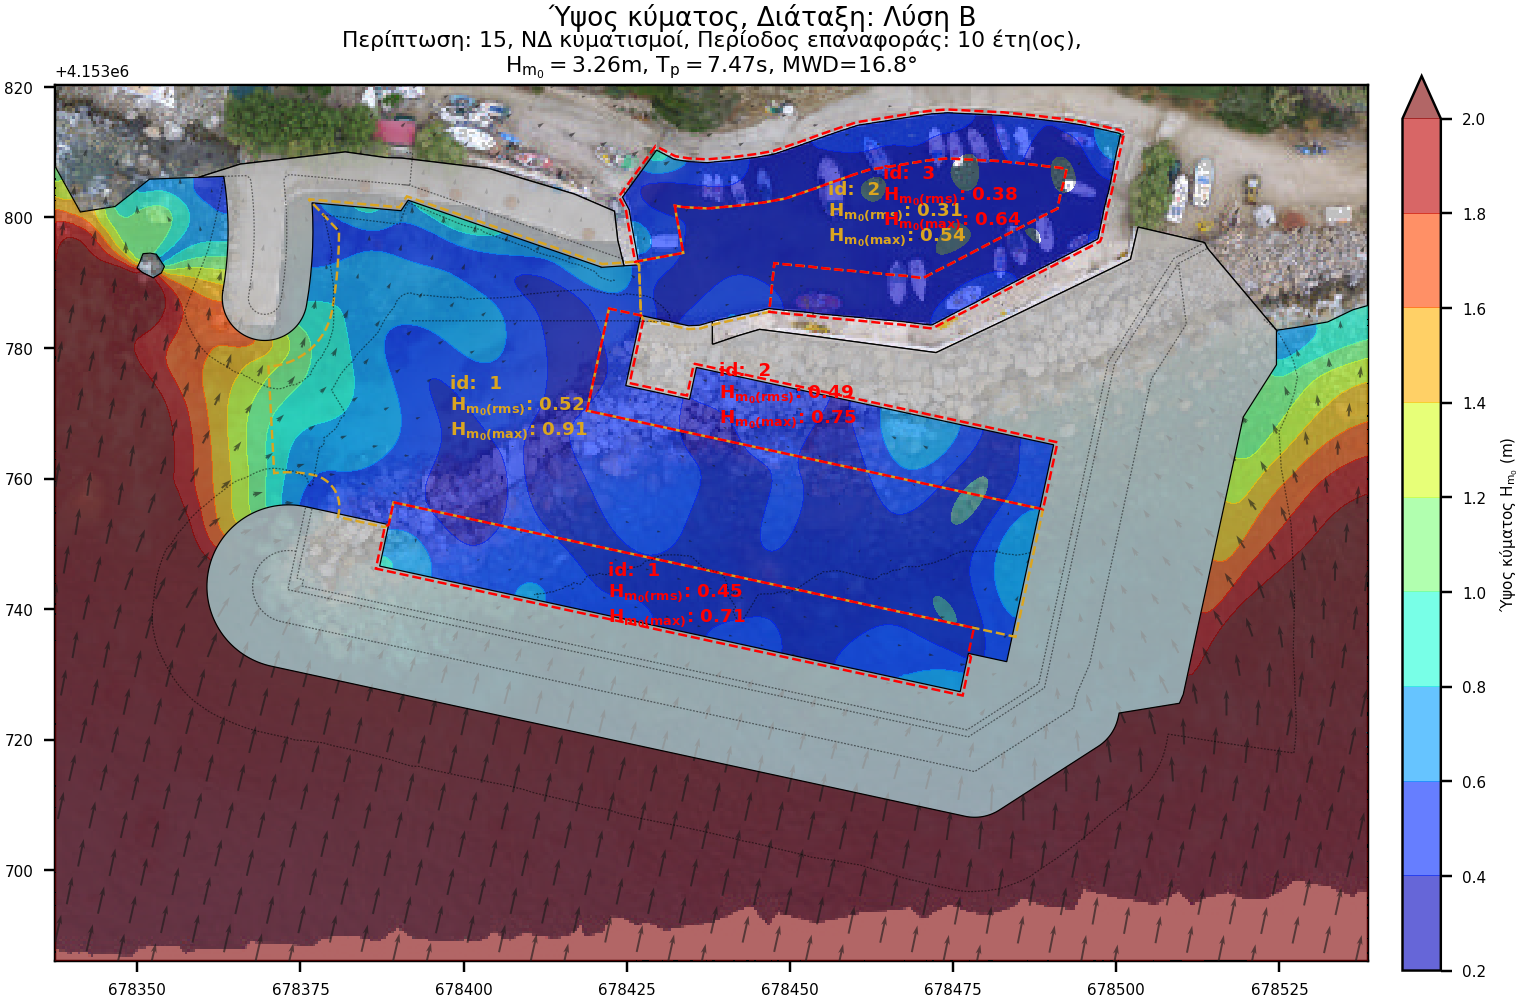
For further analysis and objective comparison of the results, areas of interest have been defined for every layout. For each area, the following parameters have been calculated:
- Active (Ηm0(rms)) and maximum wave height (Hm0(max)) for absolute disturbance and
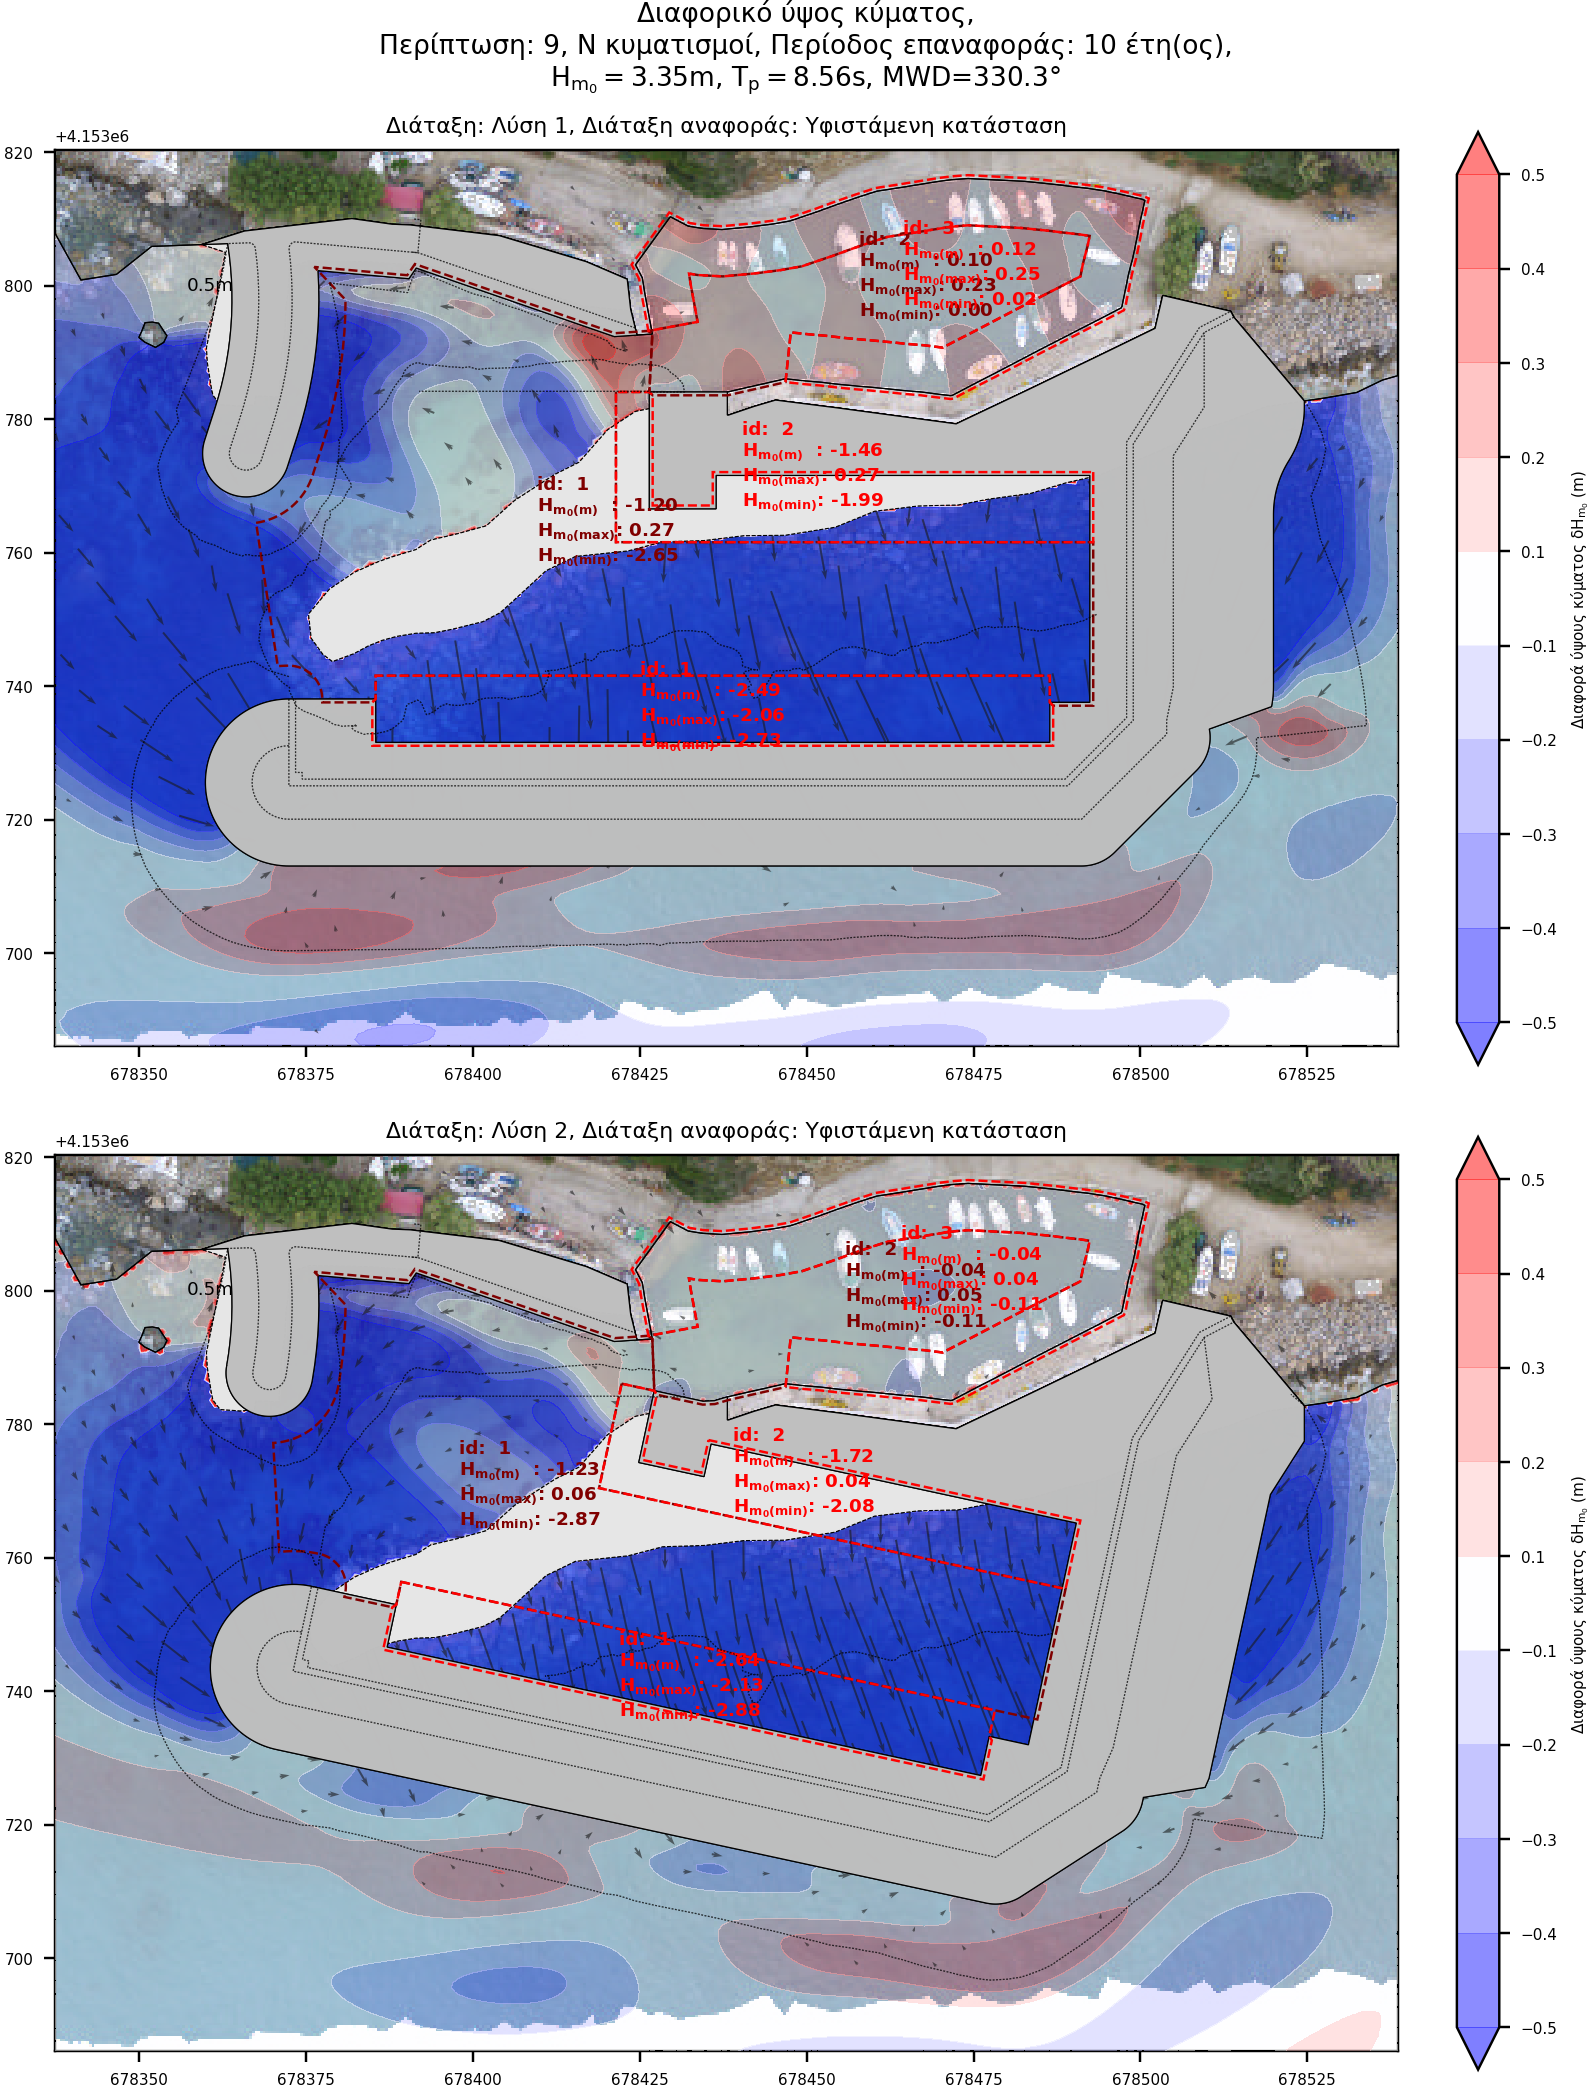
- Active (Ηm0(rms),), maximum (Hm0(max)) and minimum wave height (Hm0(min)) for differential disturbance
Absolute disturbance plots
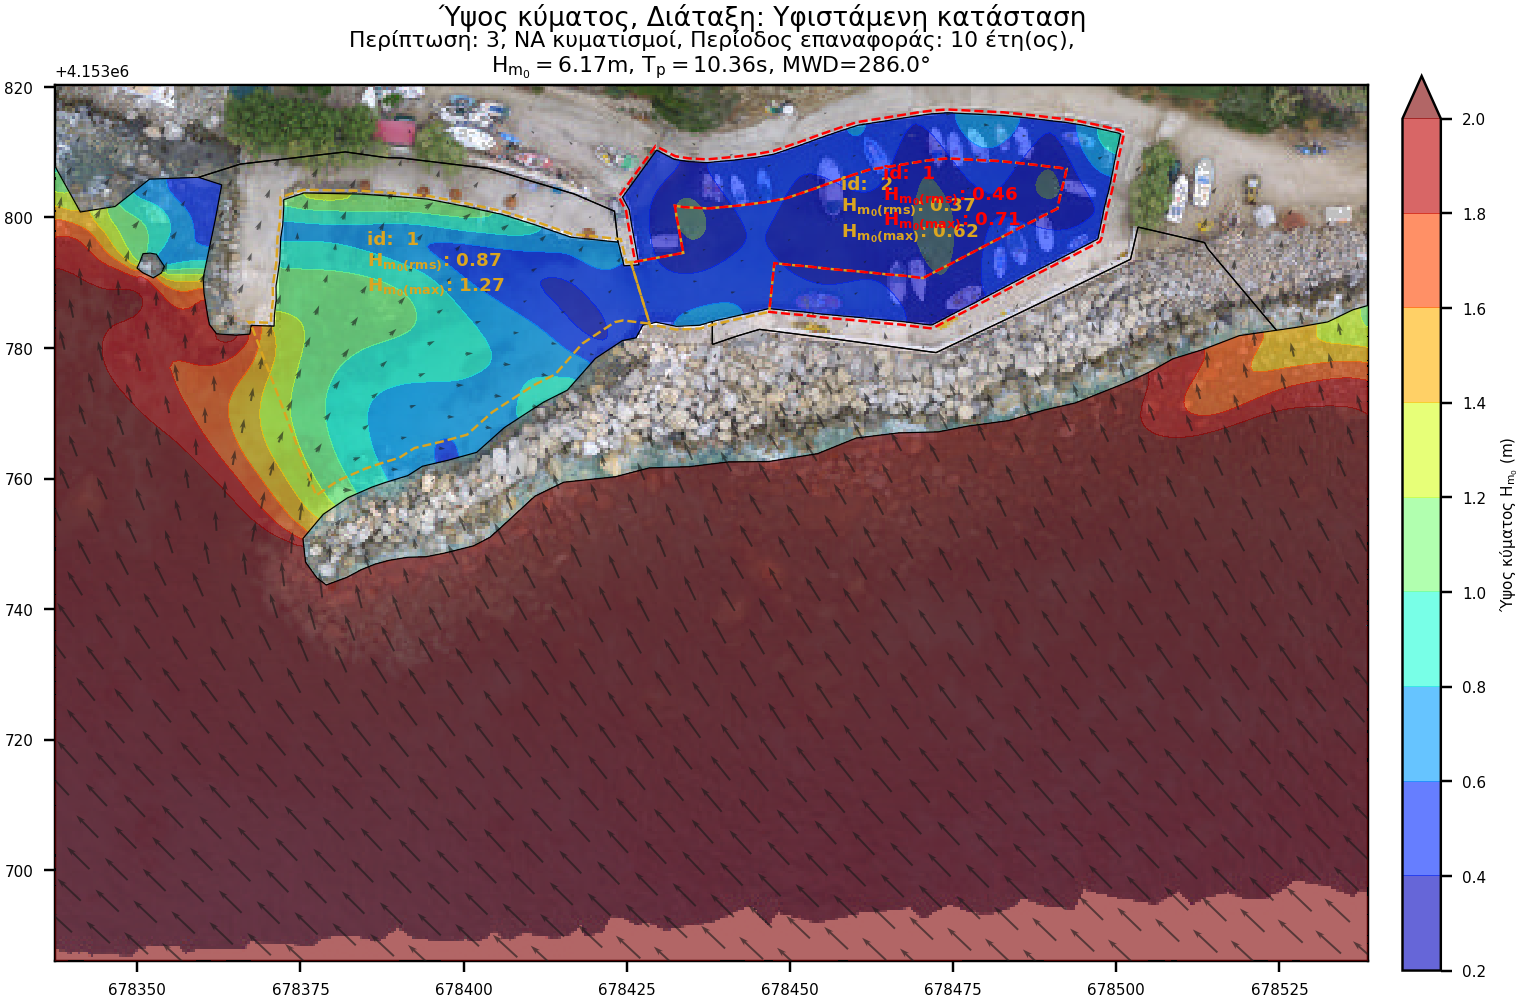
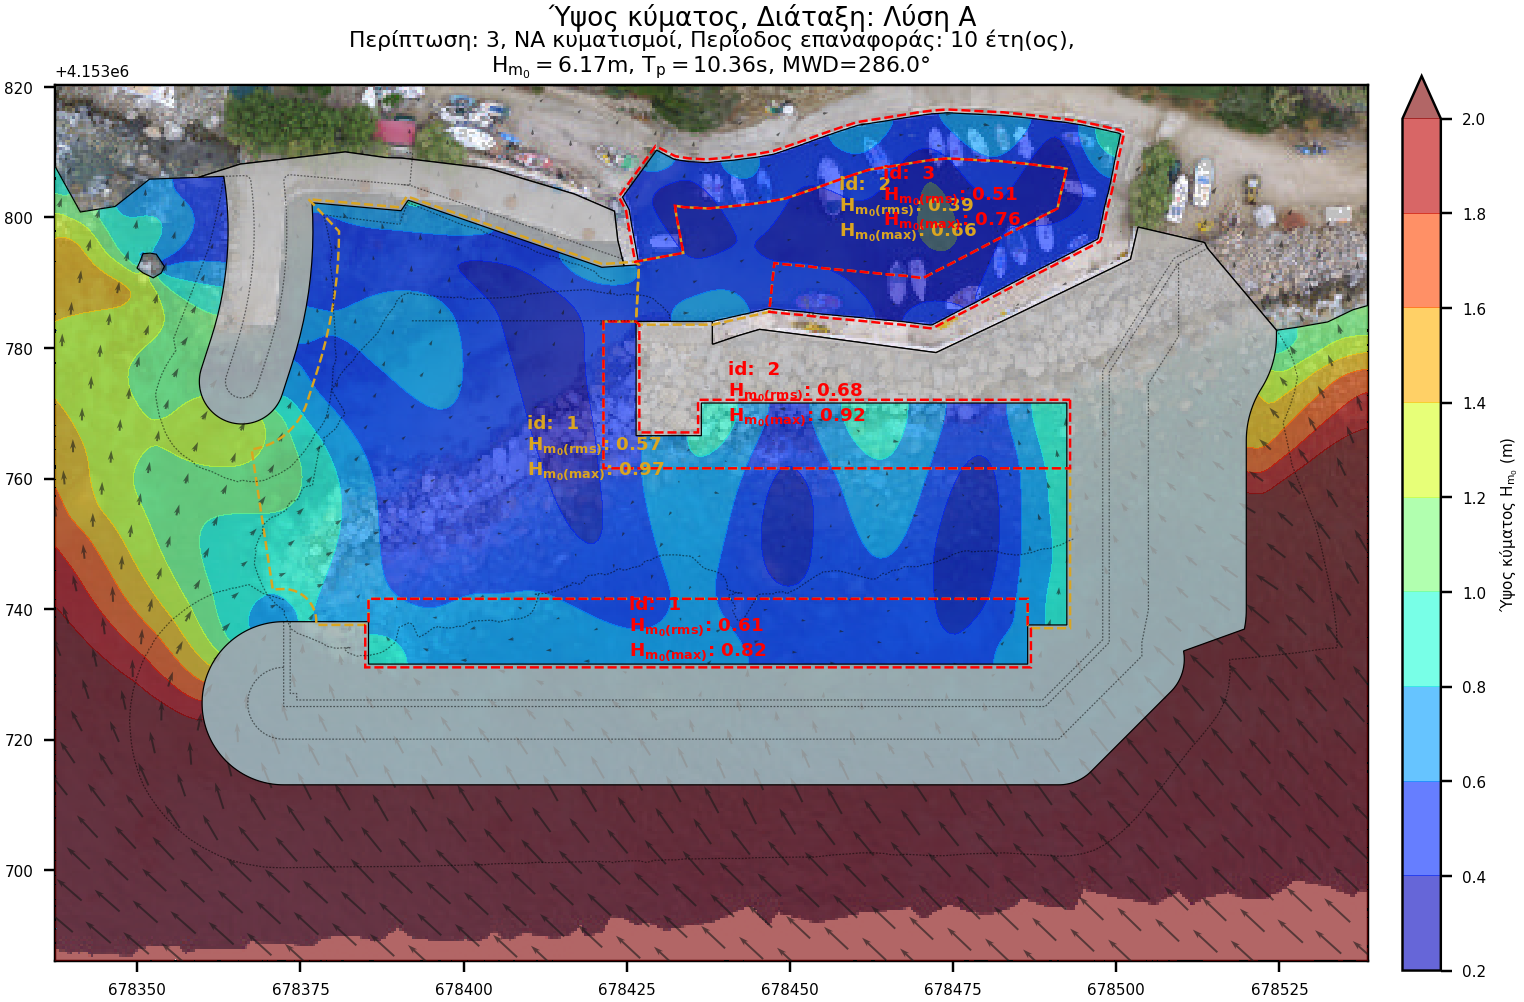
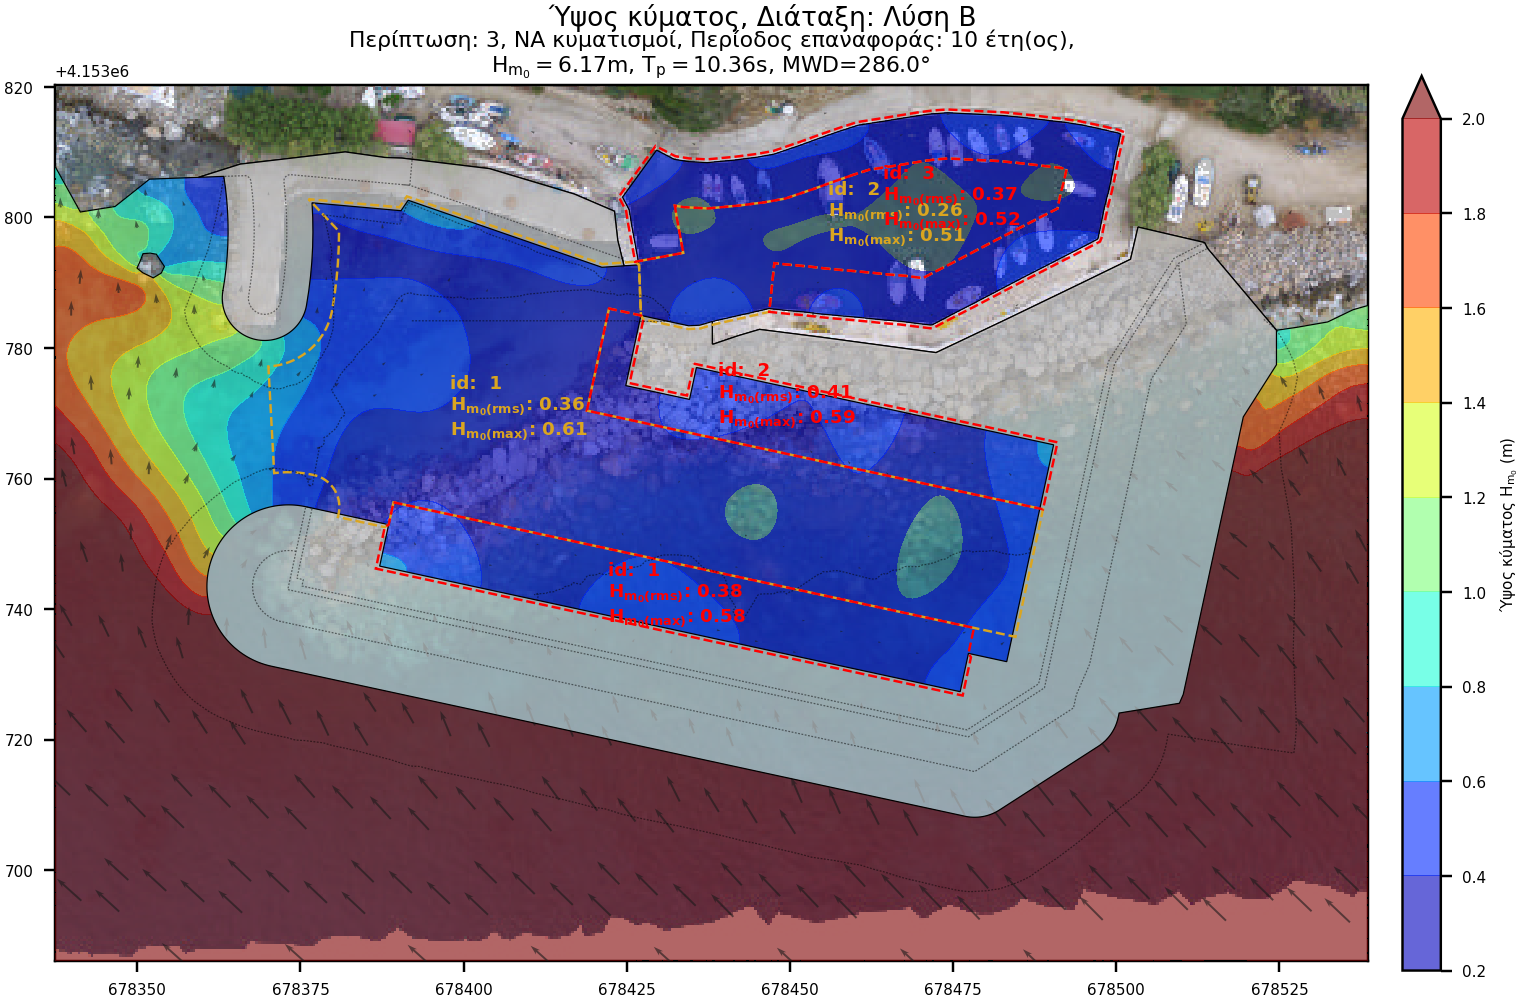
Absolute wave disturbance plots show the results of each layout for each wave case, as derived from the simulation.


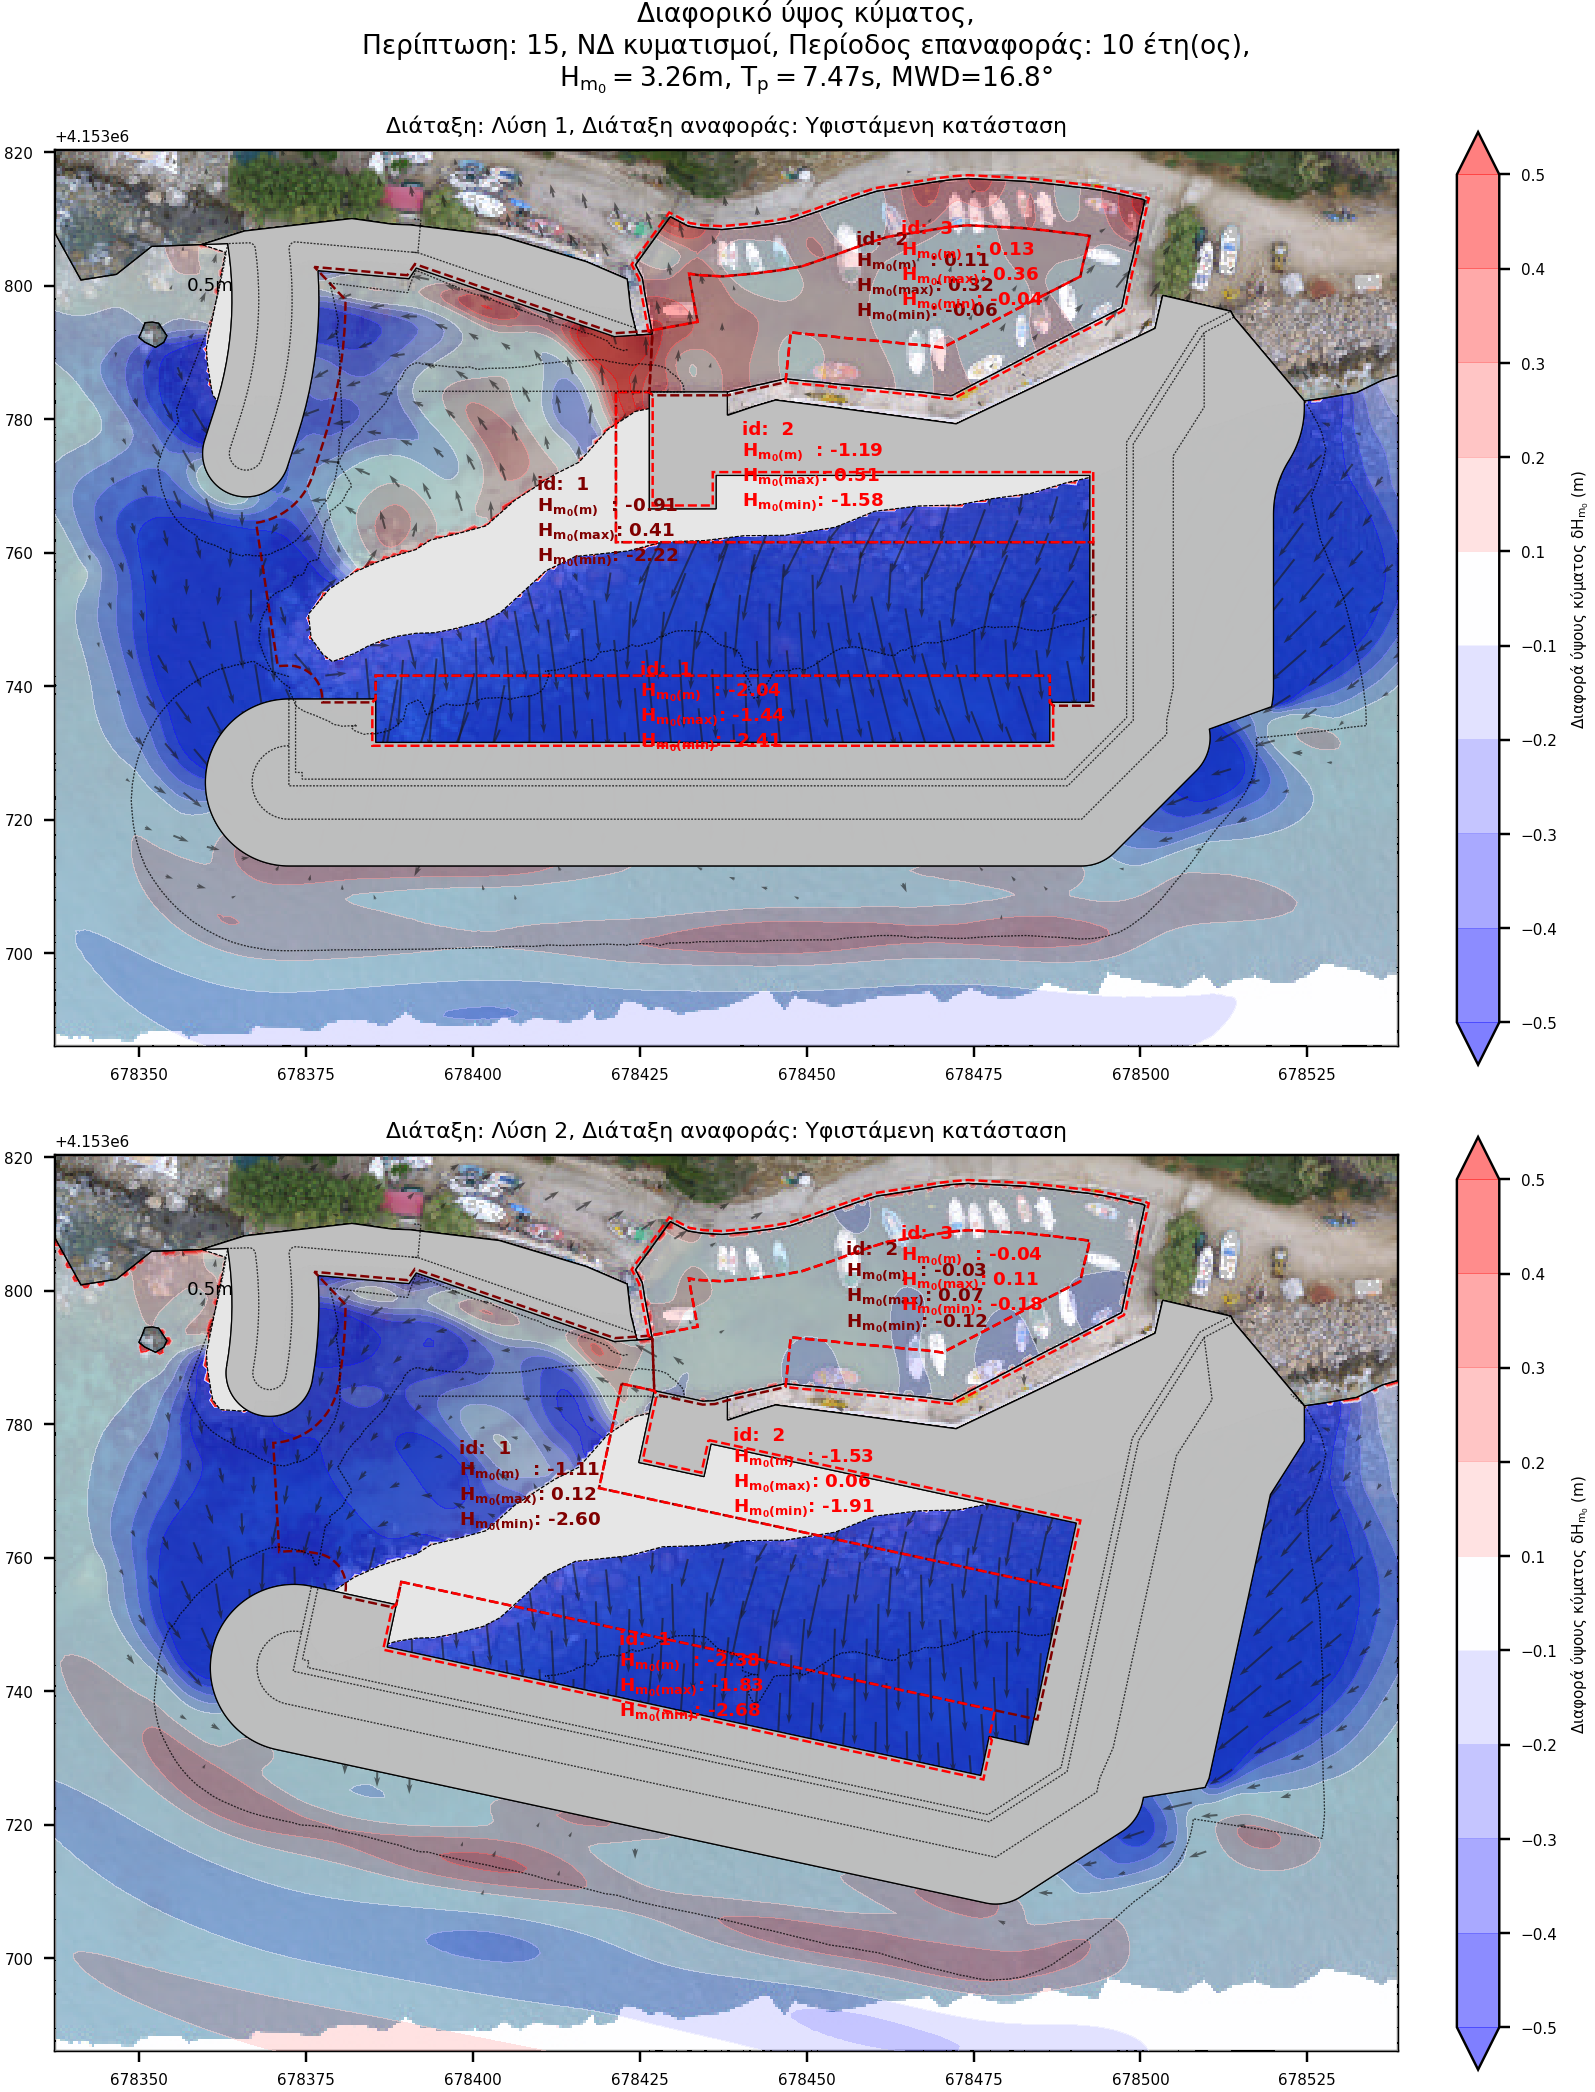
Differential disturbance plots
Differential wave disturbance plots result from the algebraic subtraction of the wave disturbance between the compared layouts. The "Reference Layout" disturbance is subtracted from the disturbance of the solution under consideration. Positive differential disturbance (red gradient), means the layout under consideration causes more disturbance than the reference layout whereas negative differential disturbance (blue gradient), means the layout under consideration causes less disturbance than the reference layout.
This easily identifies the positions as well as the extent to which each layout has an advantage / disadvantage over the "Reference layout". Below is an example of differential wave disturbance of the alternative layouts with respect to the existing layout.

Quantitative evaluation
The score is calculated using an evaluation model that takes into account the following wave disturbance parameters for each zone:
- Maximum wave height (Hm0(max)),
- Wave height exceeding predefined limits of allowable disturbance (Hm0(exc)),
- Zonal percentage area exceeding predefined limits of allowable disturbance (PAexc).
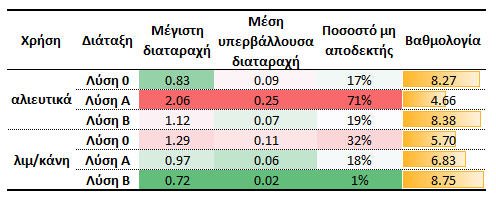
The following table summarizes the parameters calculated for each boundary indicated in the wave disturbance plots, as well as the individual score obtained.
Results
The results show that the wave disturbance of the existing layout (Layout 0), offers satisfactory berthing conditions, however the basin area does not. Layout A experiences significant disturbance and is considered unacceptable. Layout B provides adequate sheltering both in the berths and in the basin area. In extreme wave events, with a recovery period of 10 years, the maximum wave disturbance may locally exceed 1m, however, on average 81% of the positions remain functional.
In view of the above, Layout A was rejected as inappropriate and Layout B was proposed.