Sediment transport study for the Paros port Master Plan
The sediment transport study is complementary to the project entitled "Paros Port Master Plan", commissioned to CNWAY in April 2016.
Scope
The scope of this coastal engineering study waw to assess the efficiency of the existing and proposed works layout with regards to preventing:
- Potential siltation in the port basin.
- Potential morphological changes in the adjacent coastlines.
The use of a numerical model enables the simulation of coastal and sediment transport processes thereby predicting morphological evolution. Therefore, its role is central to a coastal engineering study.
Numerical modeling
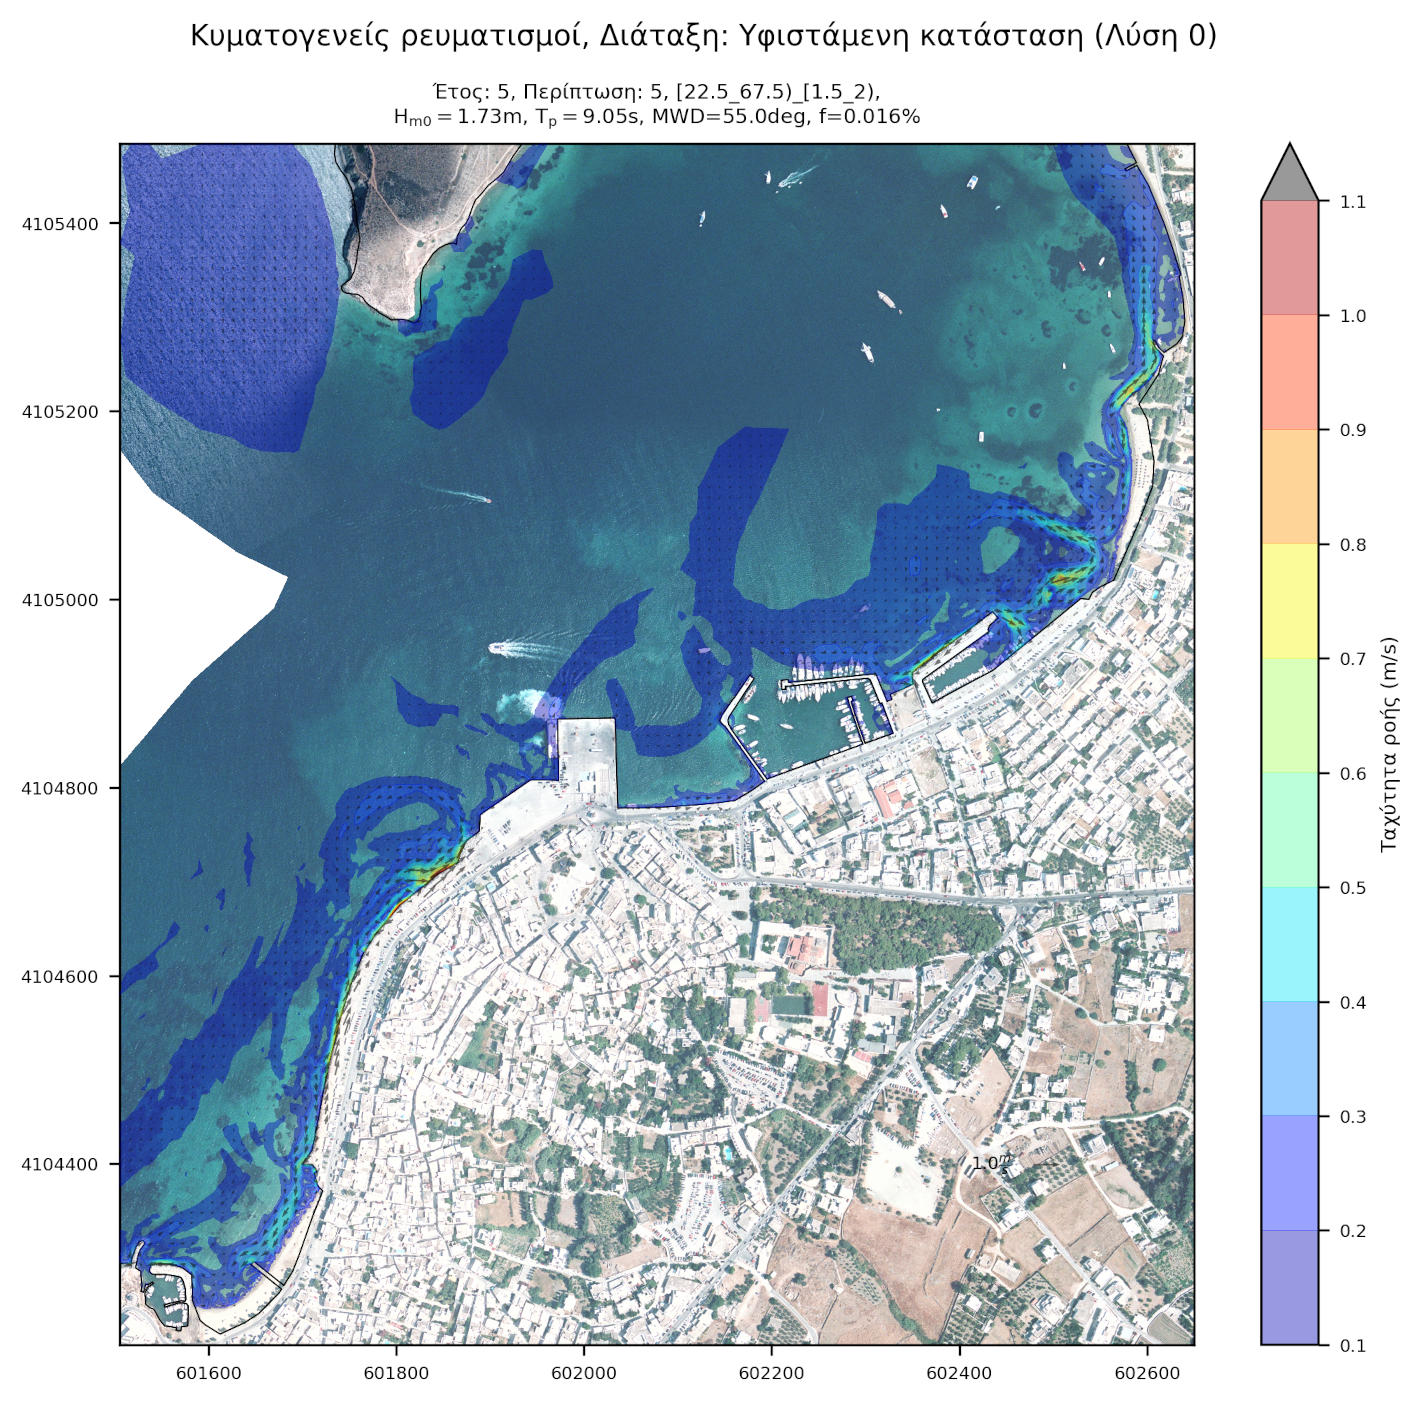
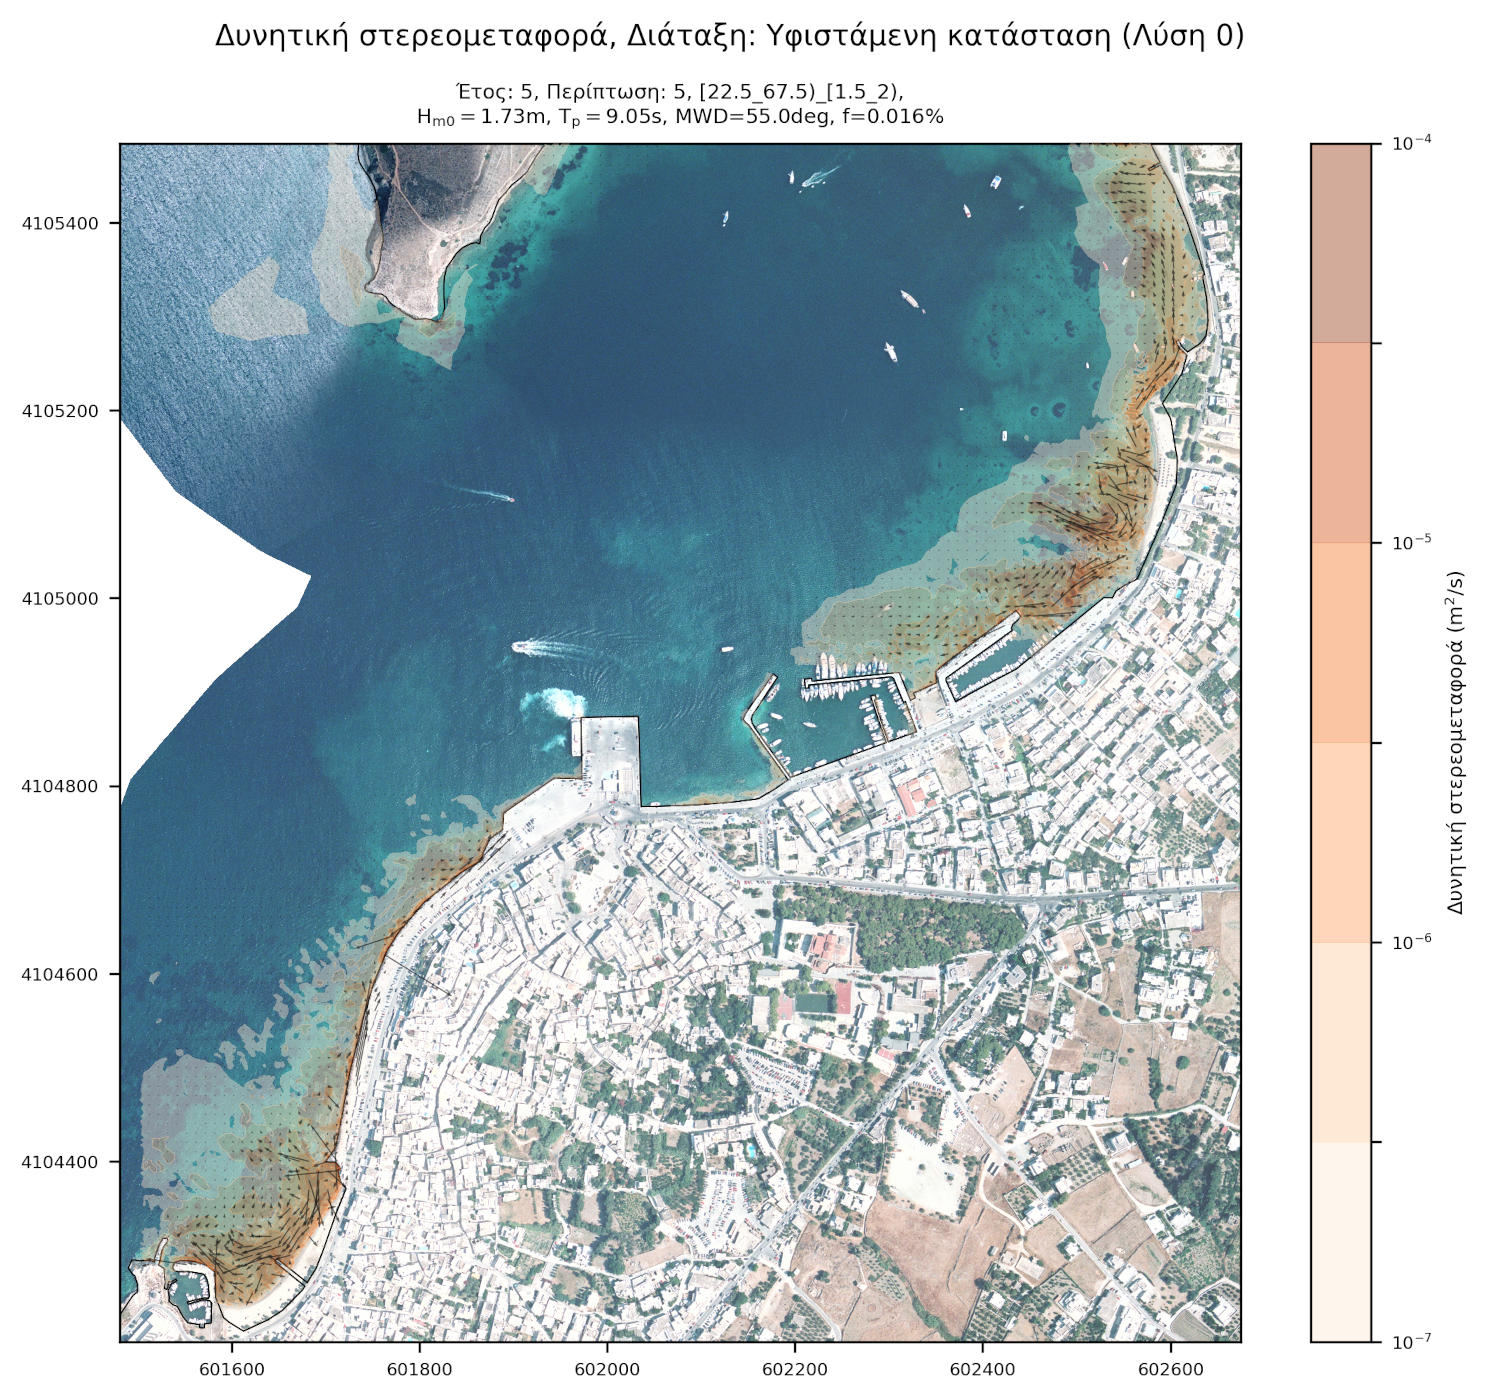
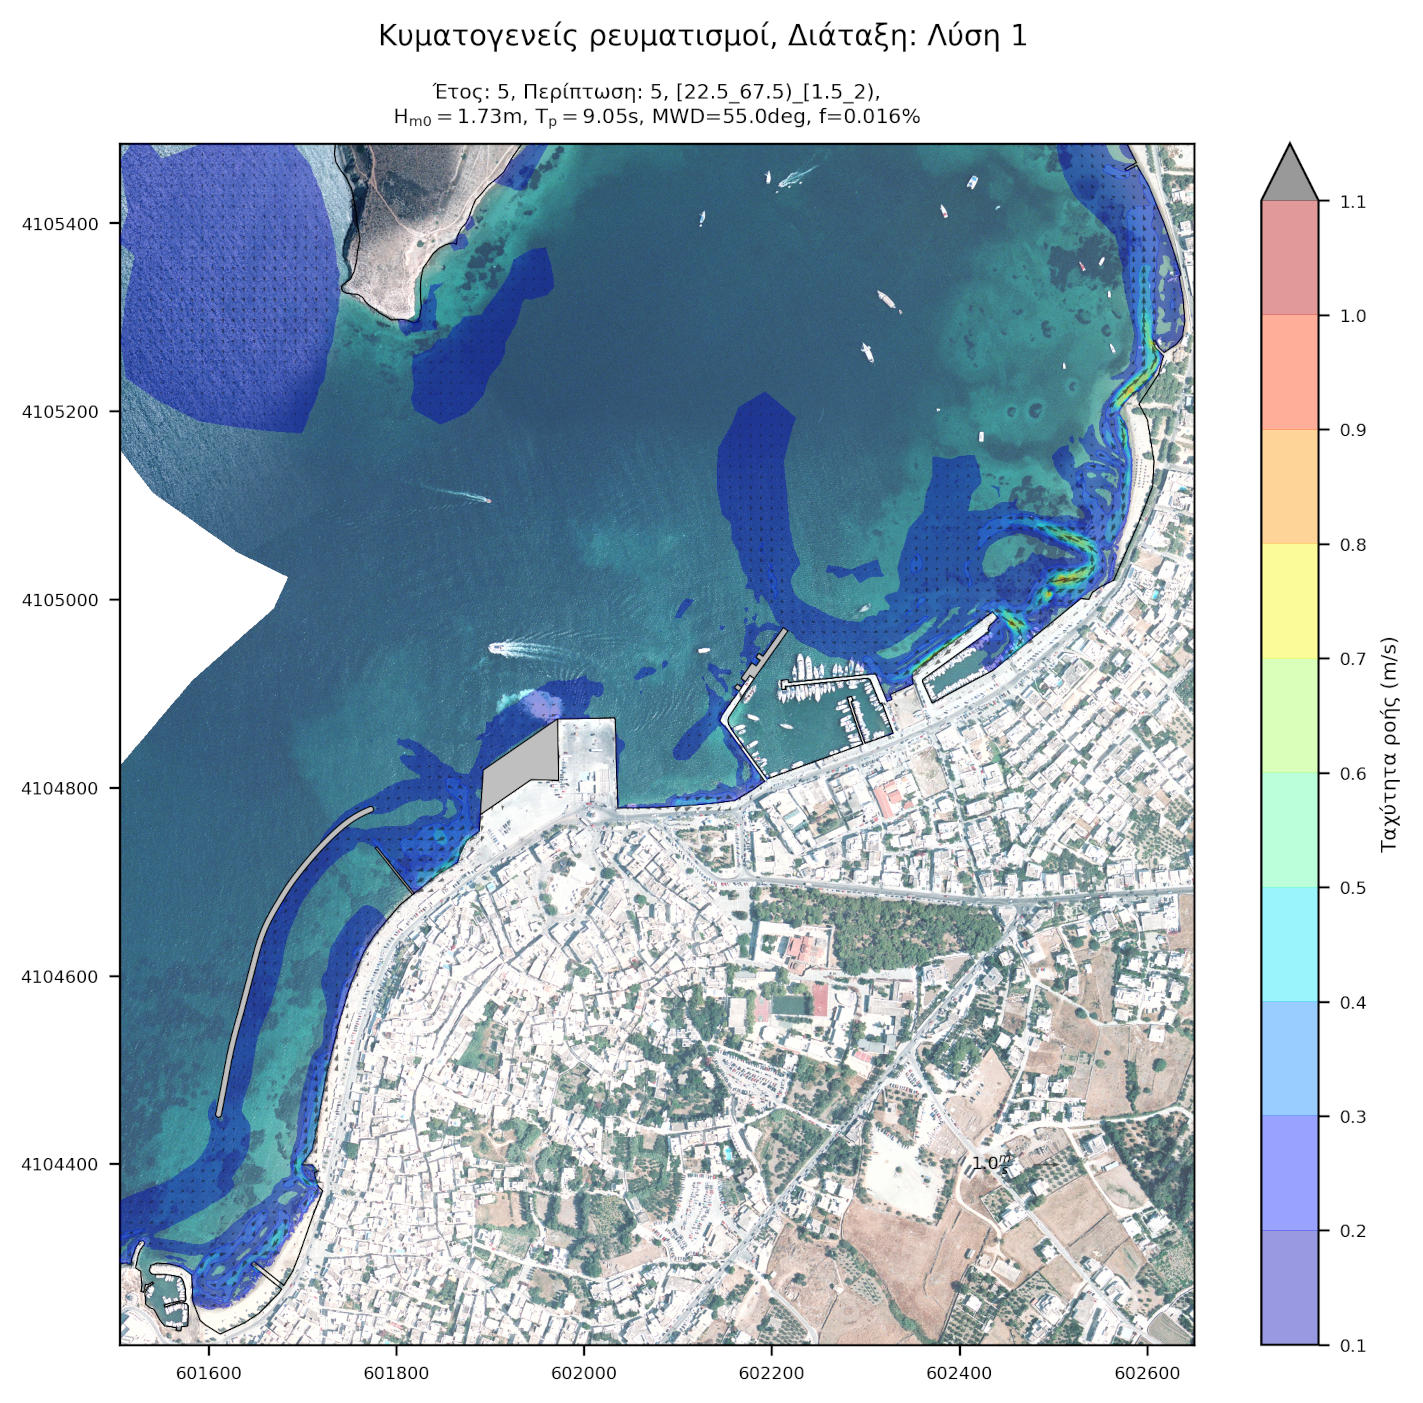
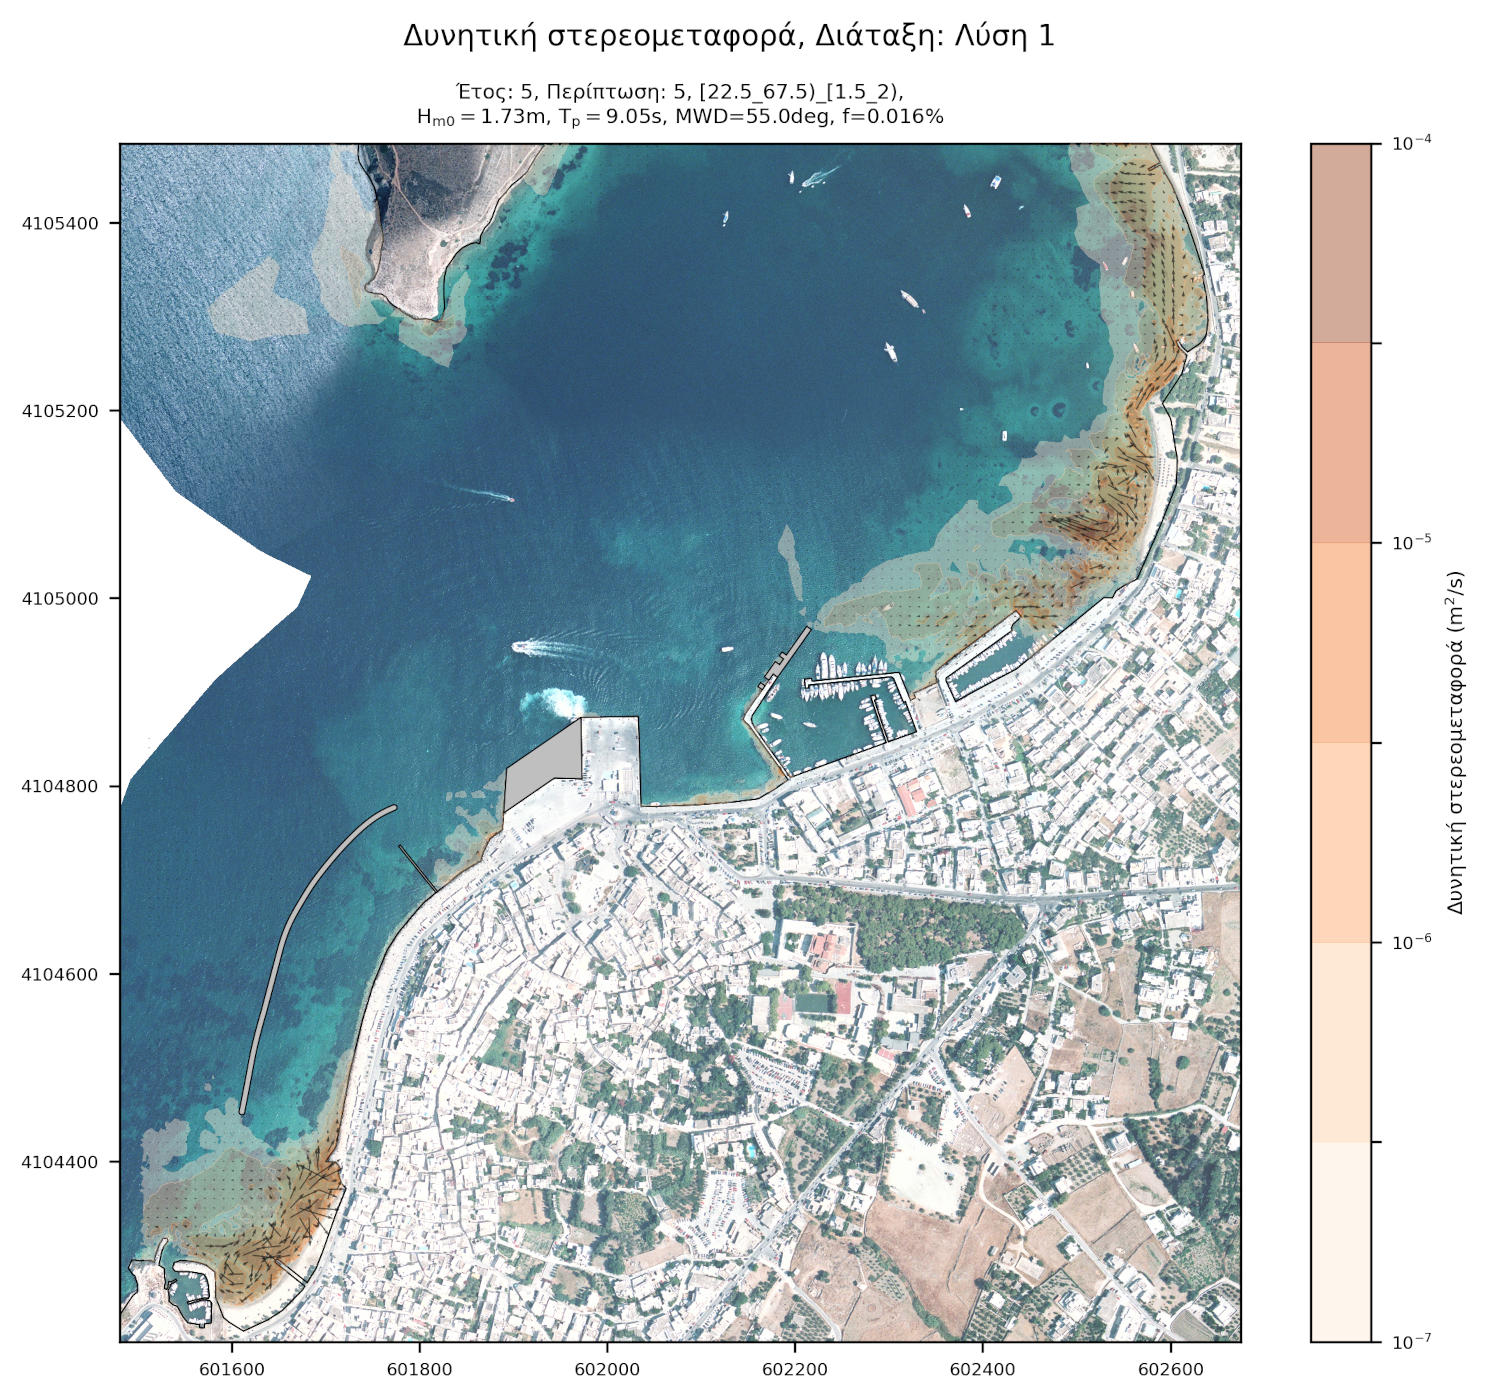
Offshore sediment transport was performed with the TMS (Telemac-Mascaret System) computing suite based on the coupling of individual models of wave propagation (TOMAWAC and ARTEMIS), wave-induced currents (TELEMAC2D) and sediment transport (SISYPHE).
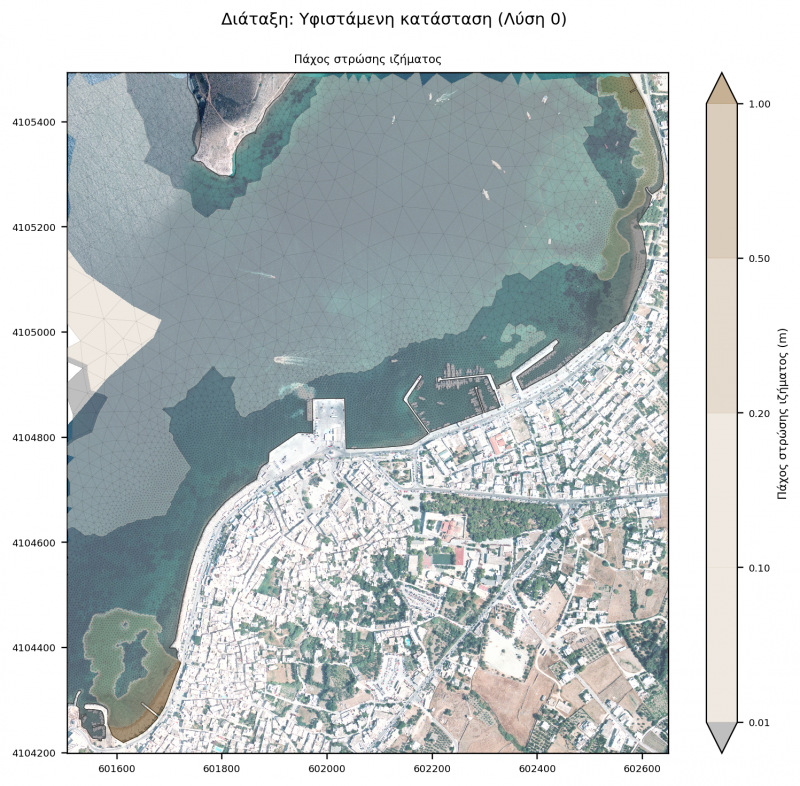
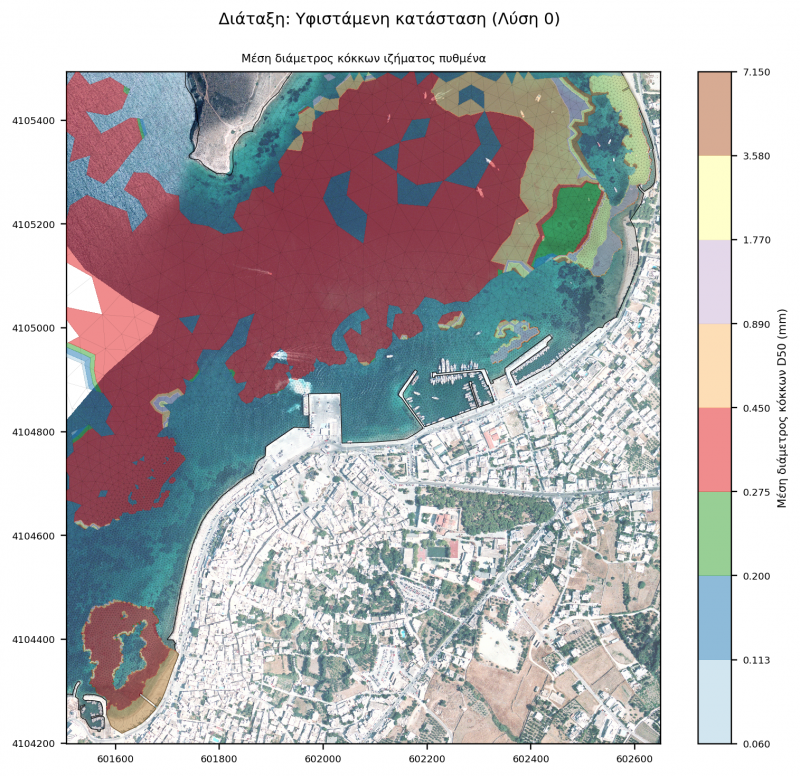
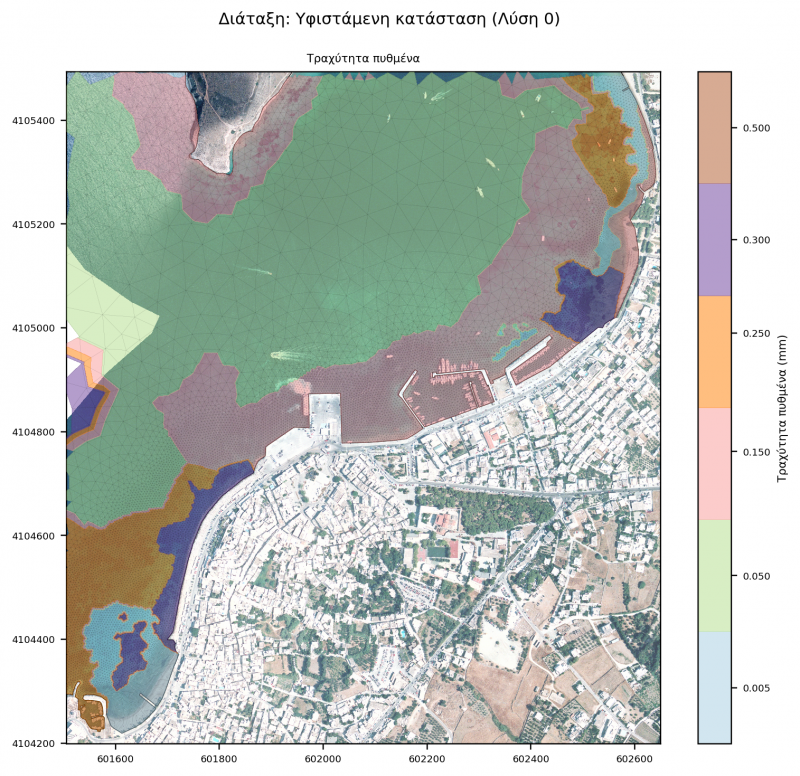
Model parameterization requires the input of sediment grading, spatial distribution and availability, as well as the spatial distribution of the corresponding friction coefficients based on the seabed texture. The spatial distribution map was created by combination of remote-sensing techniques and an appropriate on-site survey and sampling program. Specifically, the following supportive activities were carried out:
- shoreline investigation
- seabed sediment sampling at varying depths
- bathymetric and topographic survey
- photographic documentation / Aerial mapping
- marine vegetation mapping
- wind-wave climate estimation
Meticulous parameterisation ensures more accurate modeling of physical processes, enhancing the reliability of the analysis results.
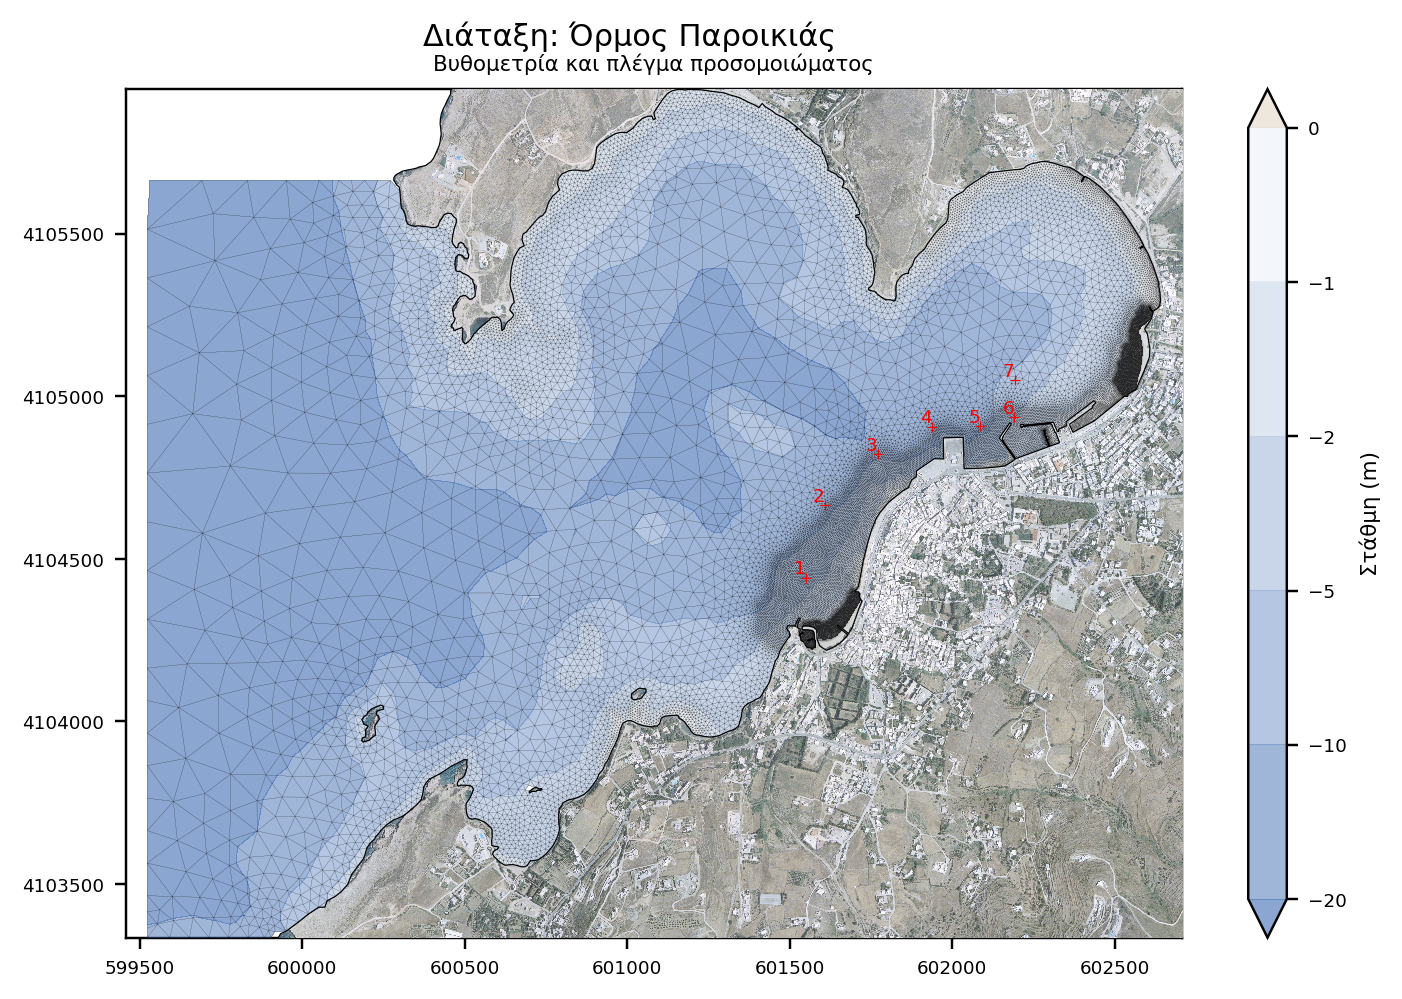
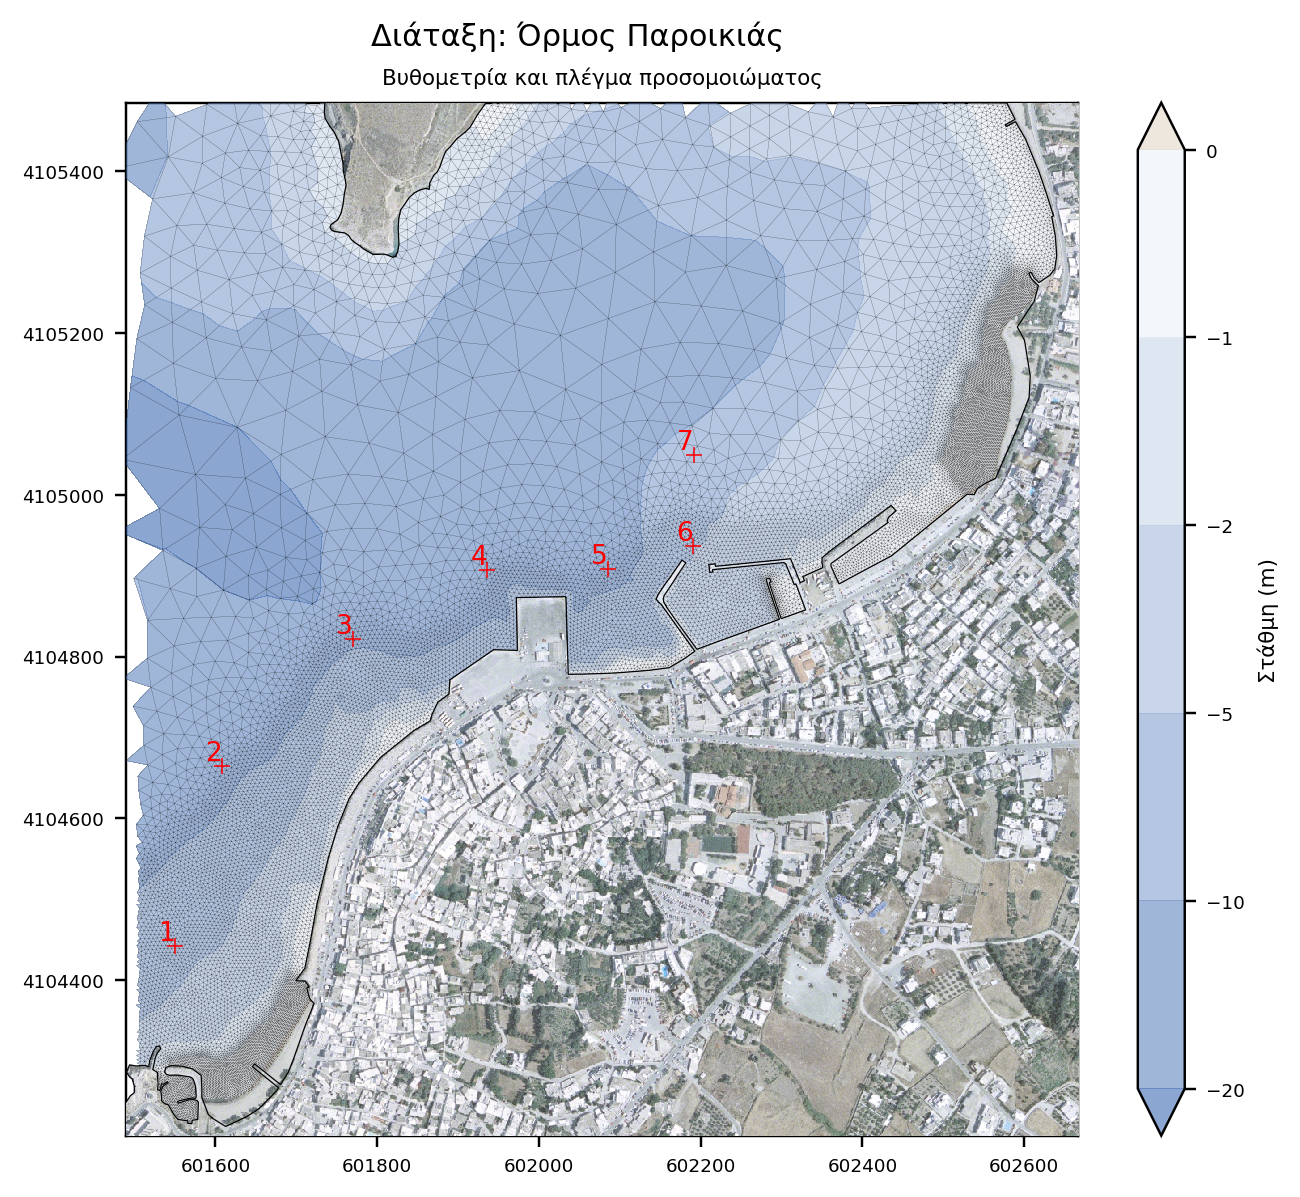
Modeling characteristics
The simulation is usually performed by employing three (3) separate models, the offshore, the nearshore and the wave disturbance model. The first extends from the position of offshore wave conditions (the node of the WAM wave model) up to the Parikia bay entrance, and its role is to prescribe boundary conditions to the nearshore model which in turn provides boundary condition (wave spectrum) to the wave disturbance models.
Offshore and nearshore model
- Offshore model: It extends 7,3 km along the E-W axis and 7,3 km laterally. It covers an area of approximately 30,3 km2 and consists of 108.000 elements and 55.000 nodes
- Nearshore model: It extends 3,2 km along the E-W axis and 2,5 km laterally. It covers an area of approximately 4,9 km2 and consists of 51.000 elements and 27.000 nodes

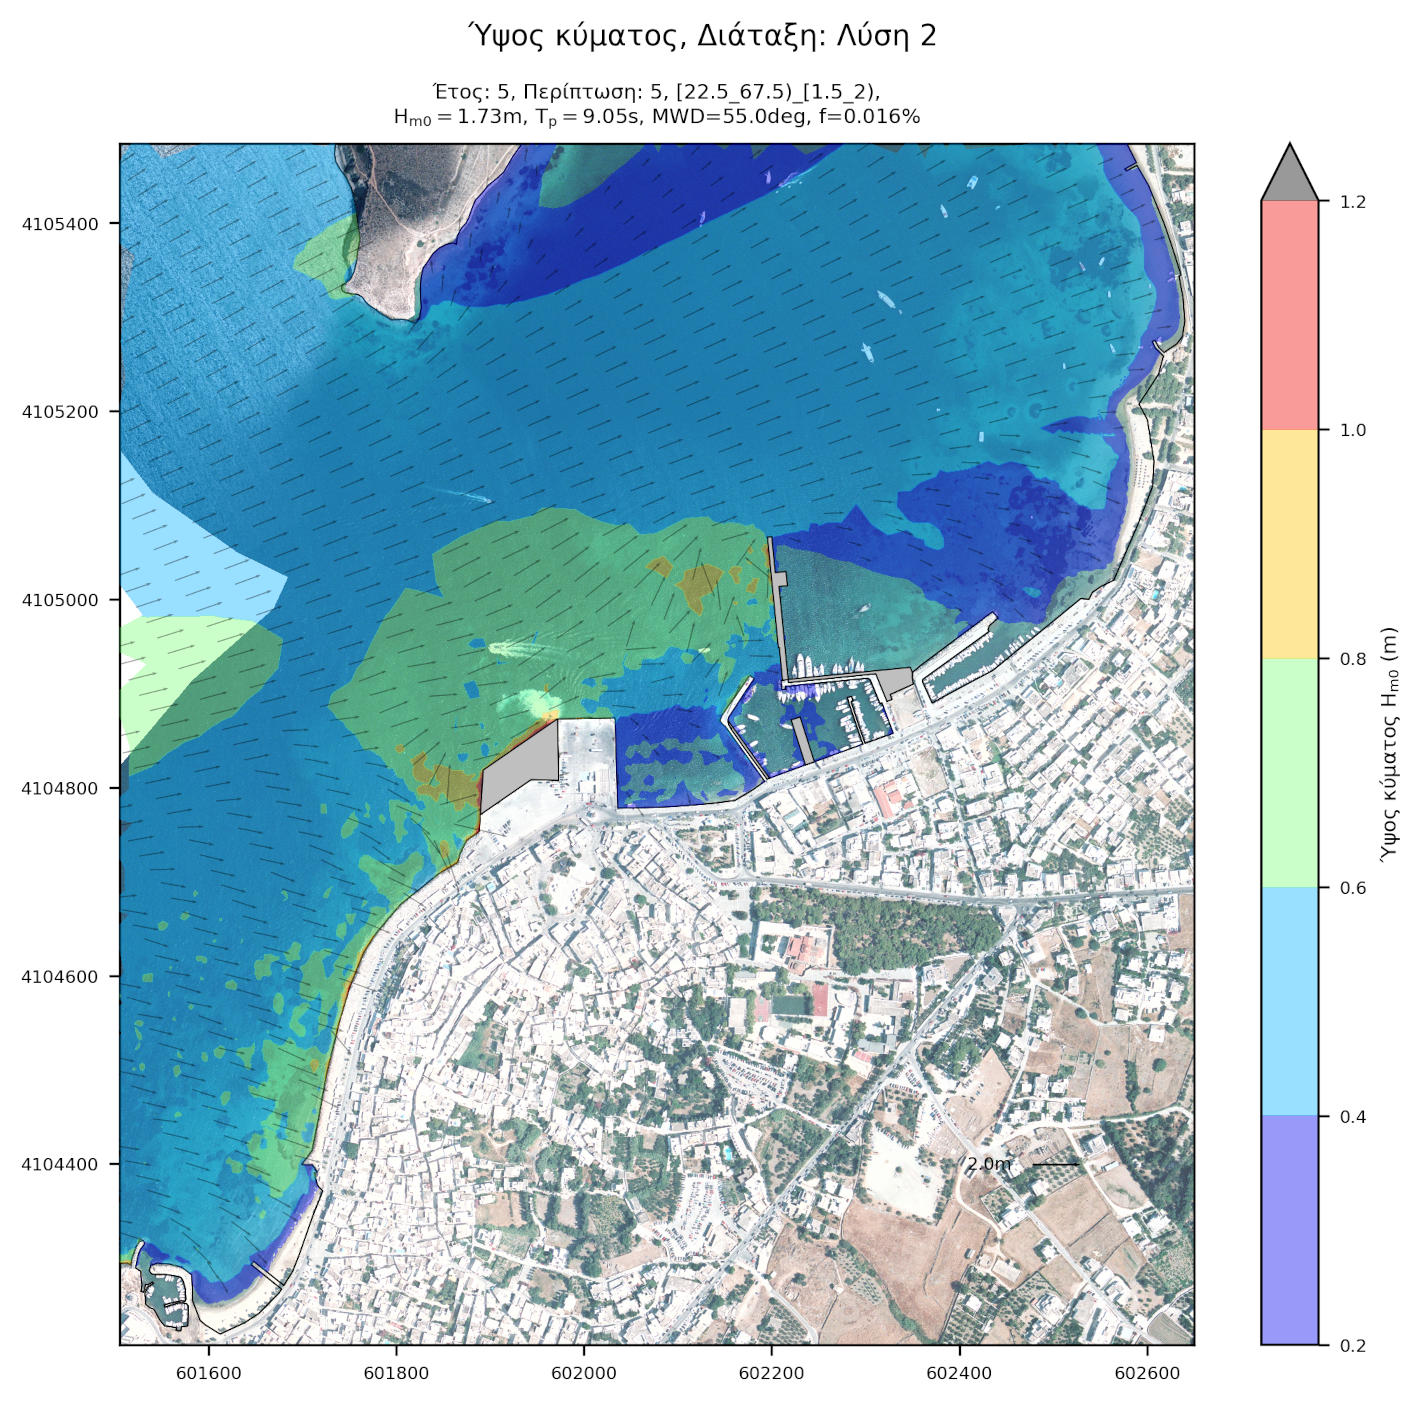
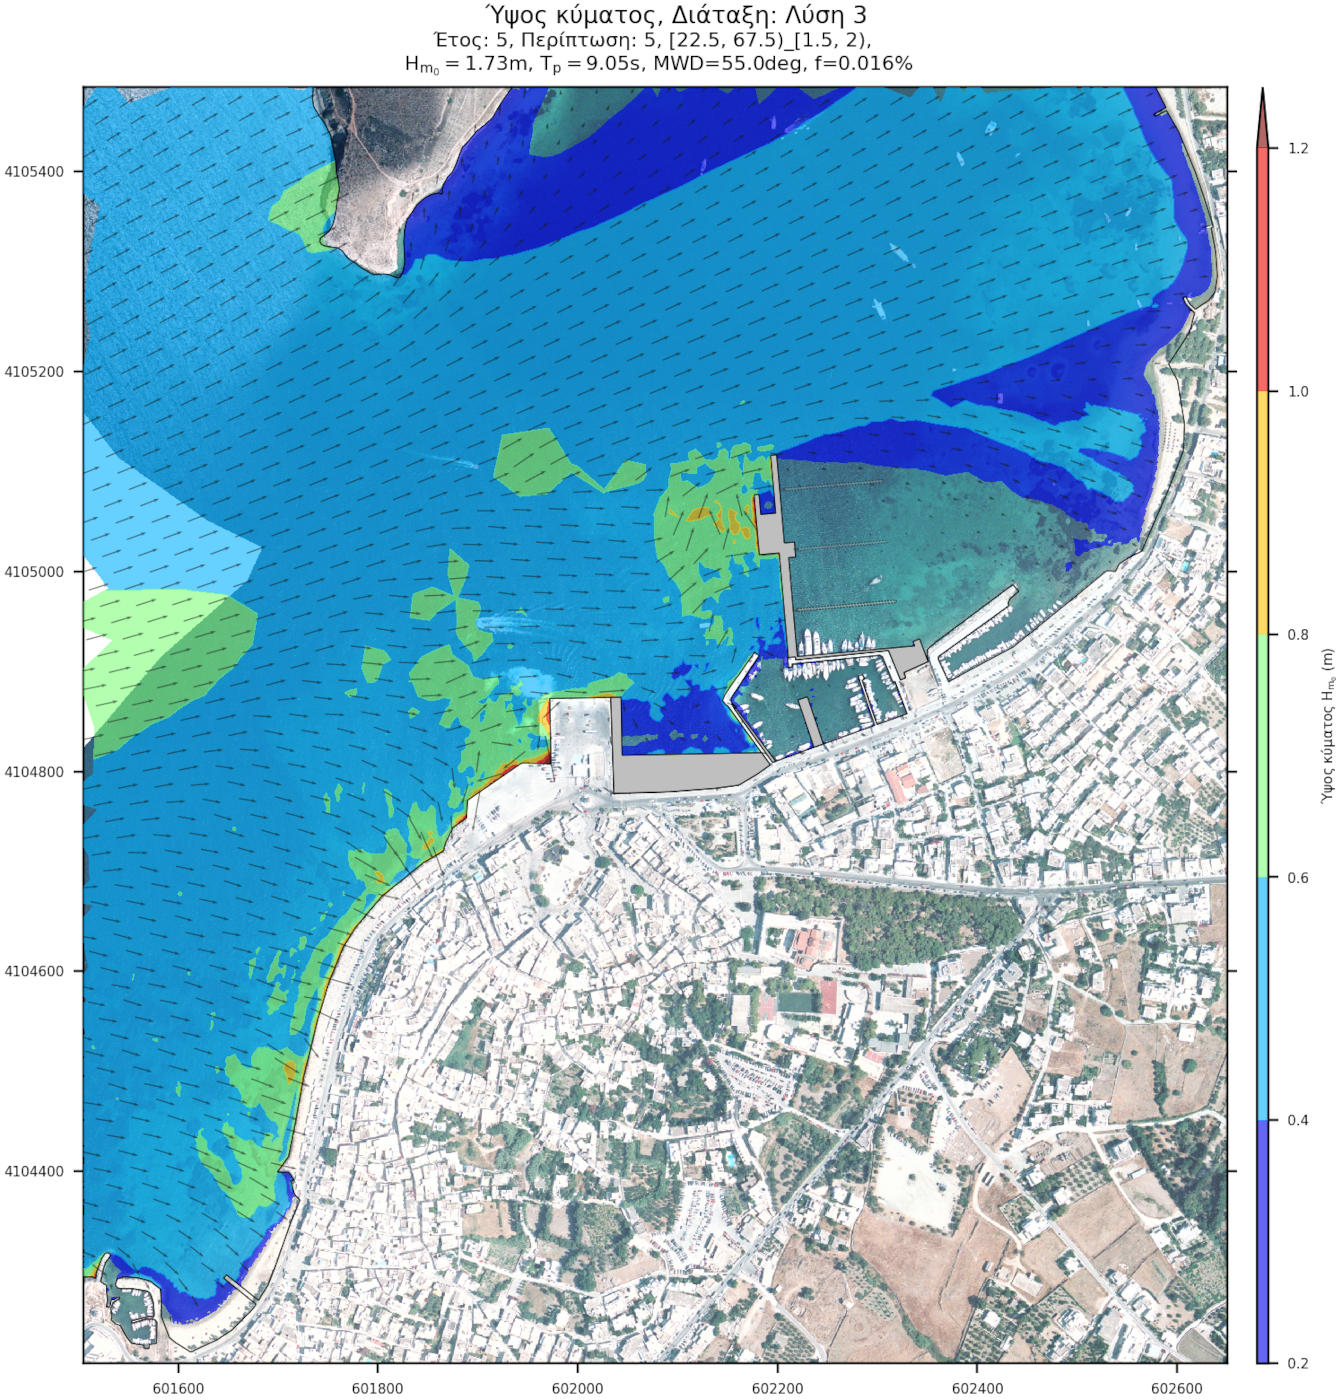
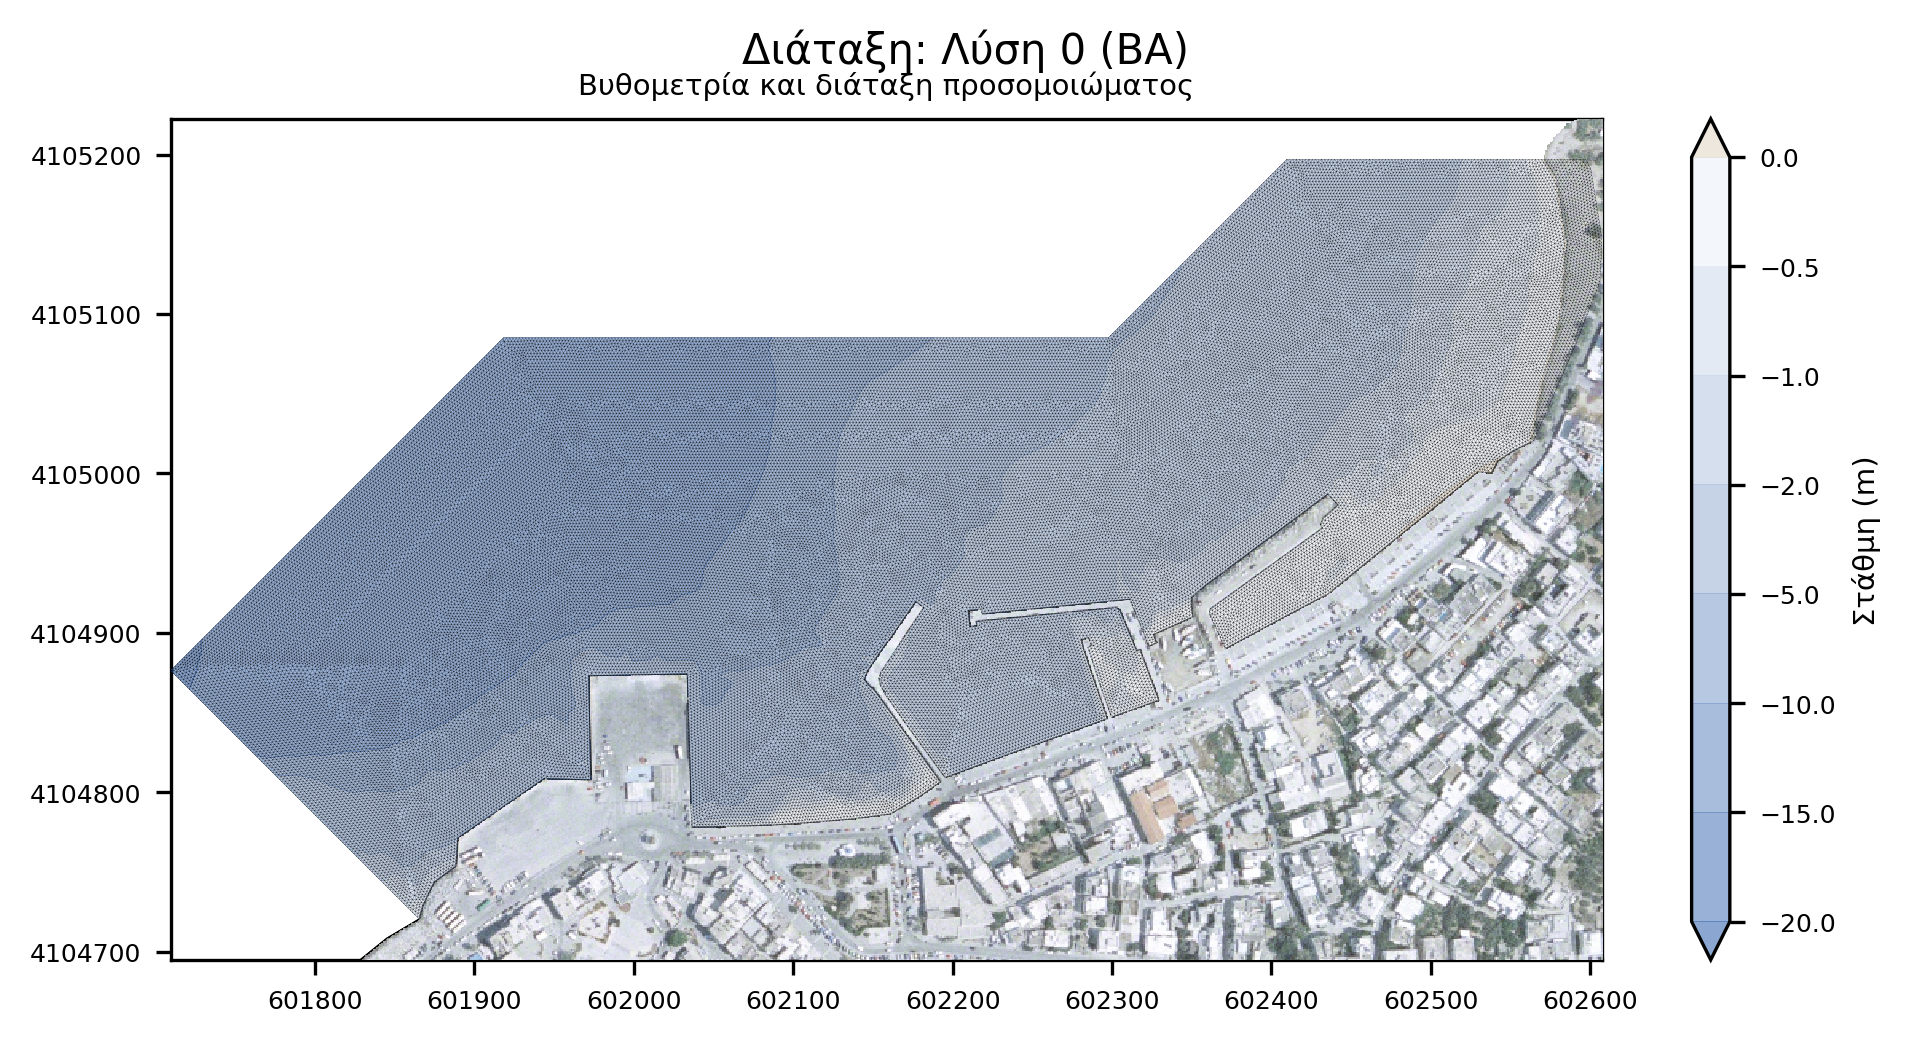
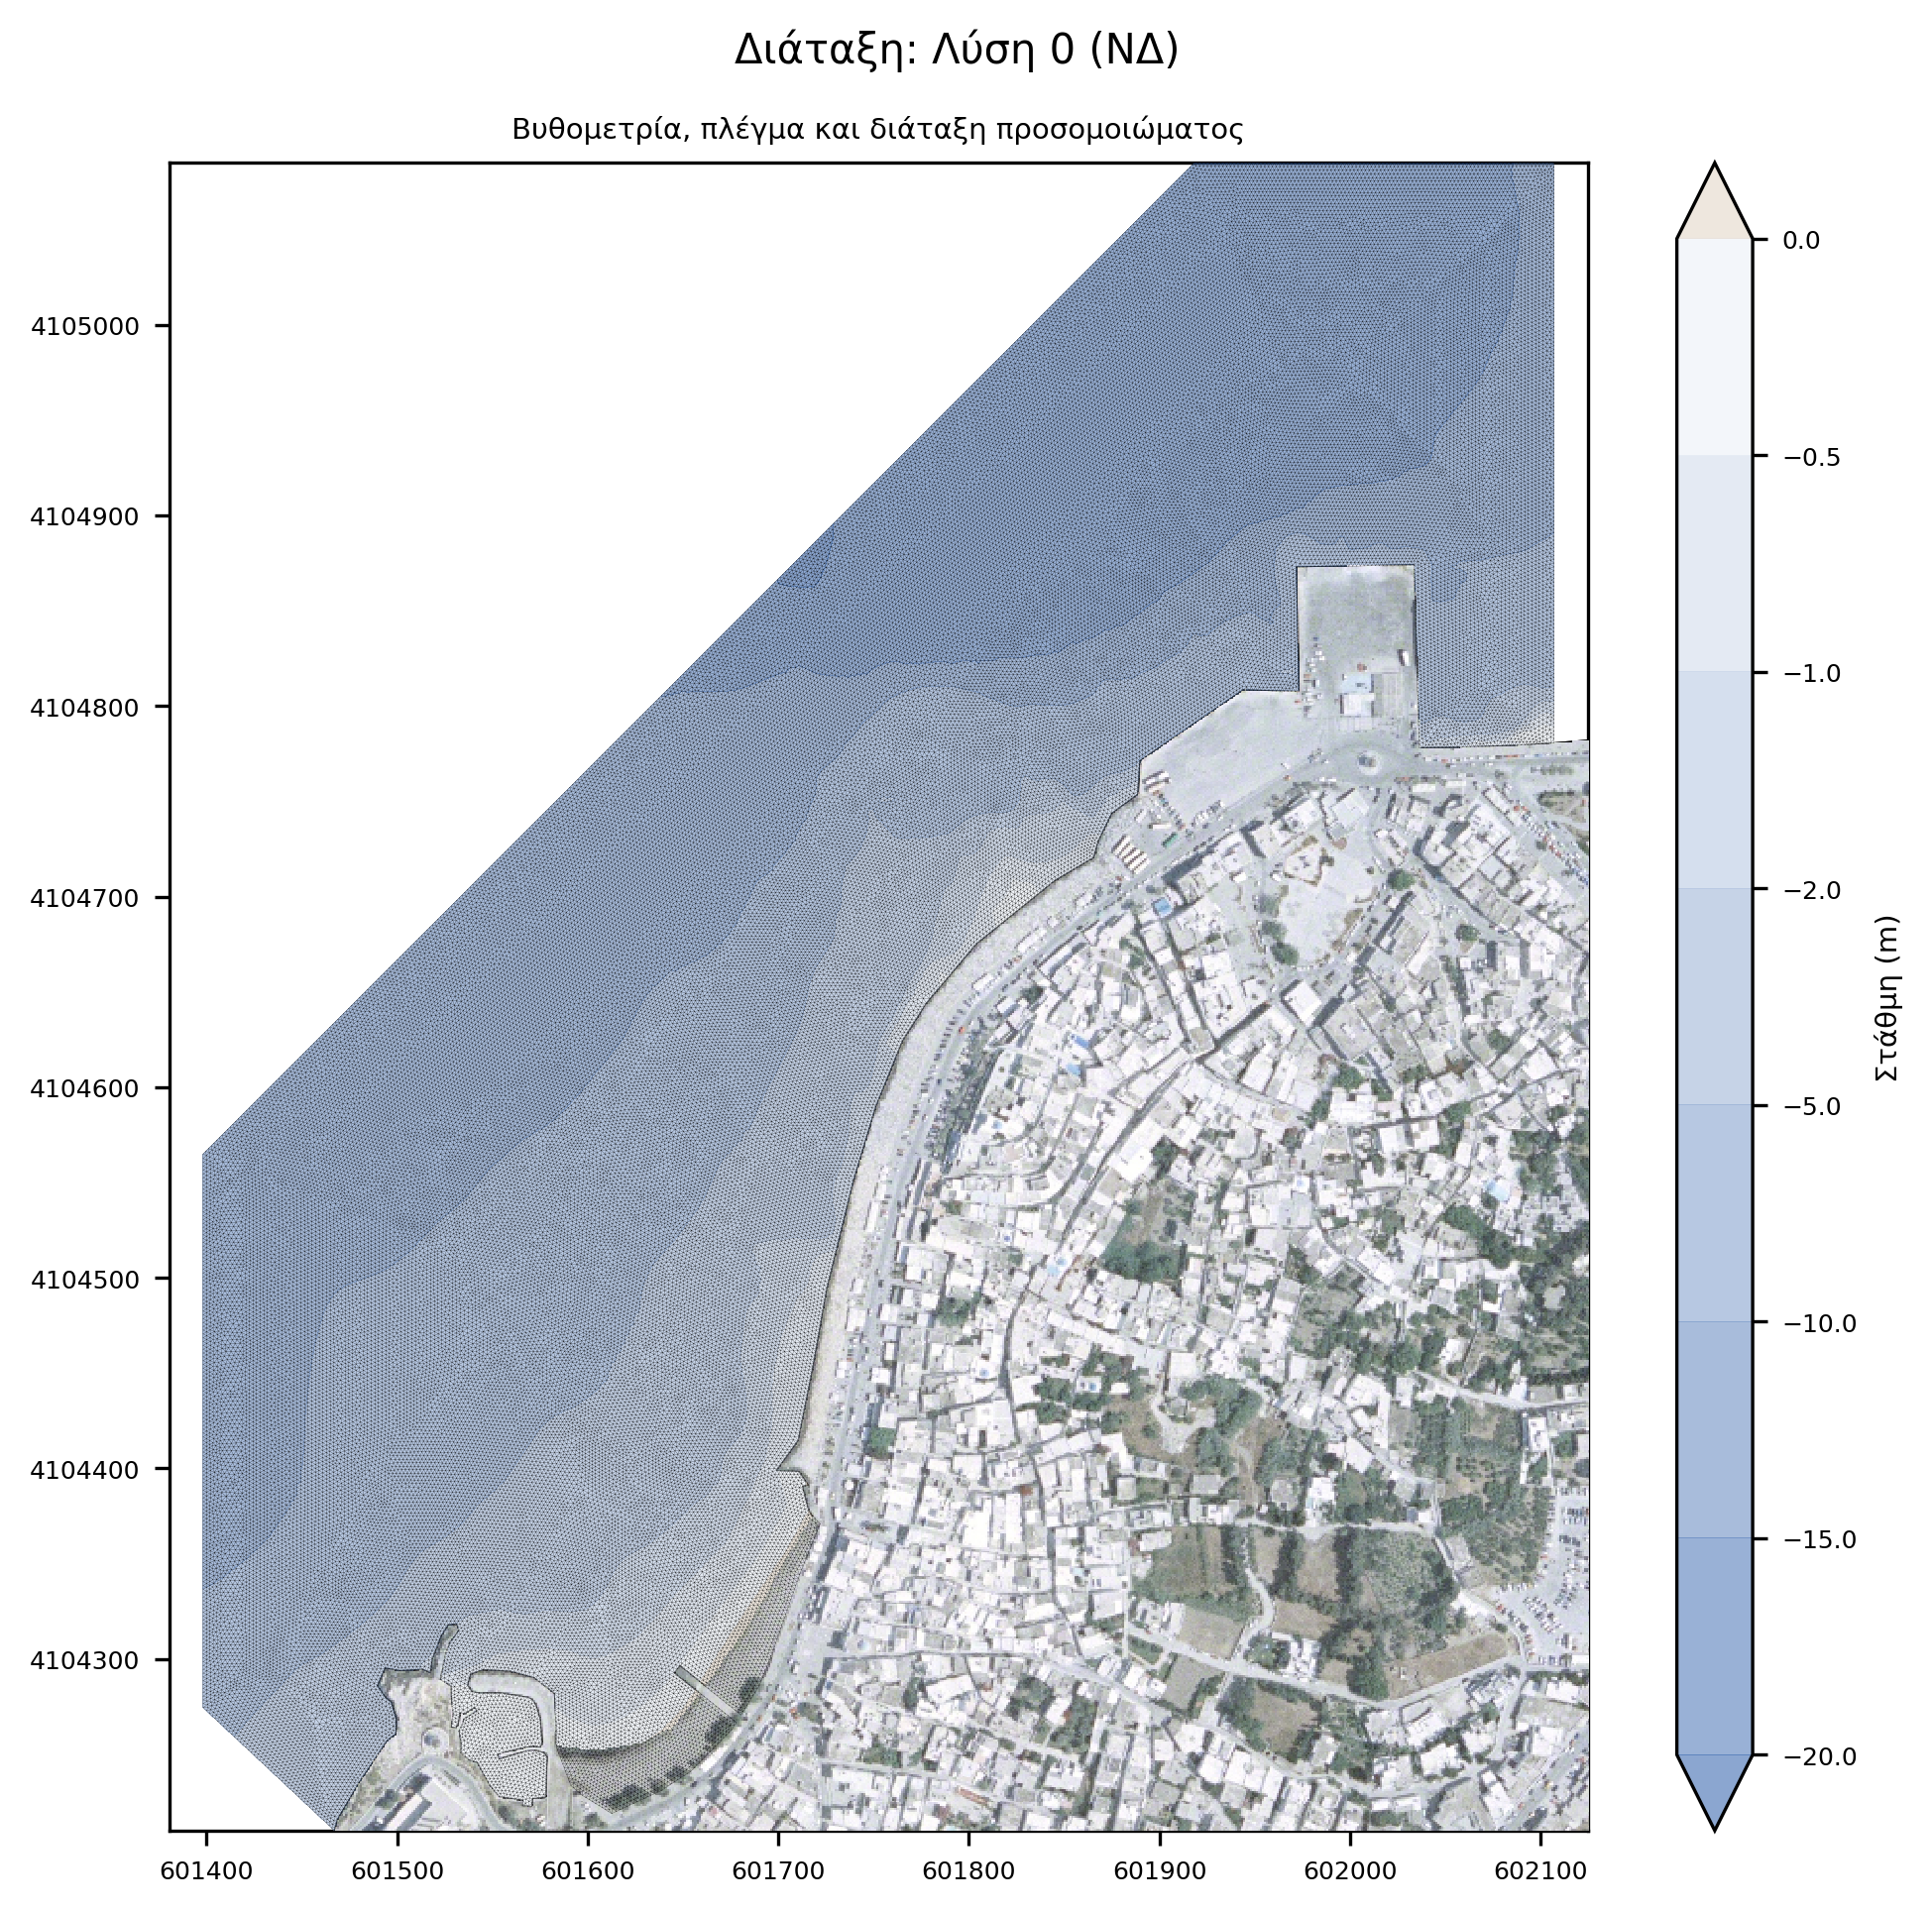
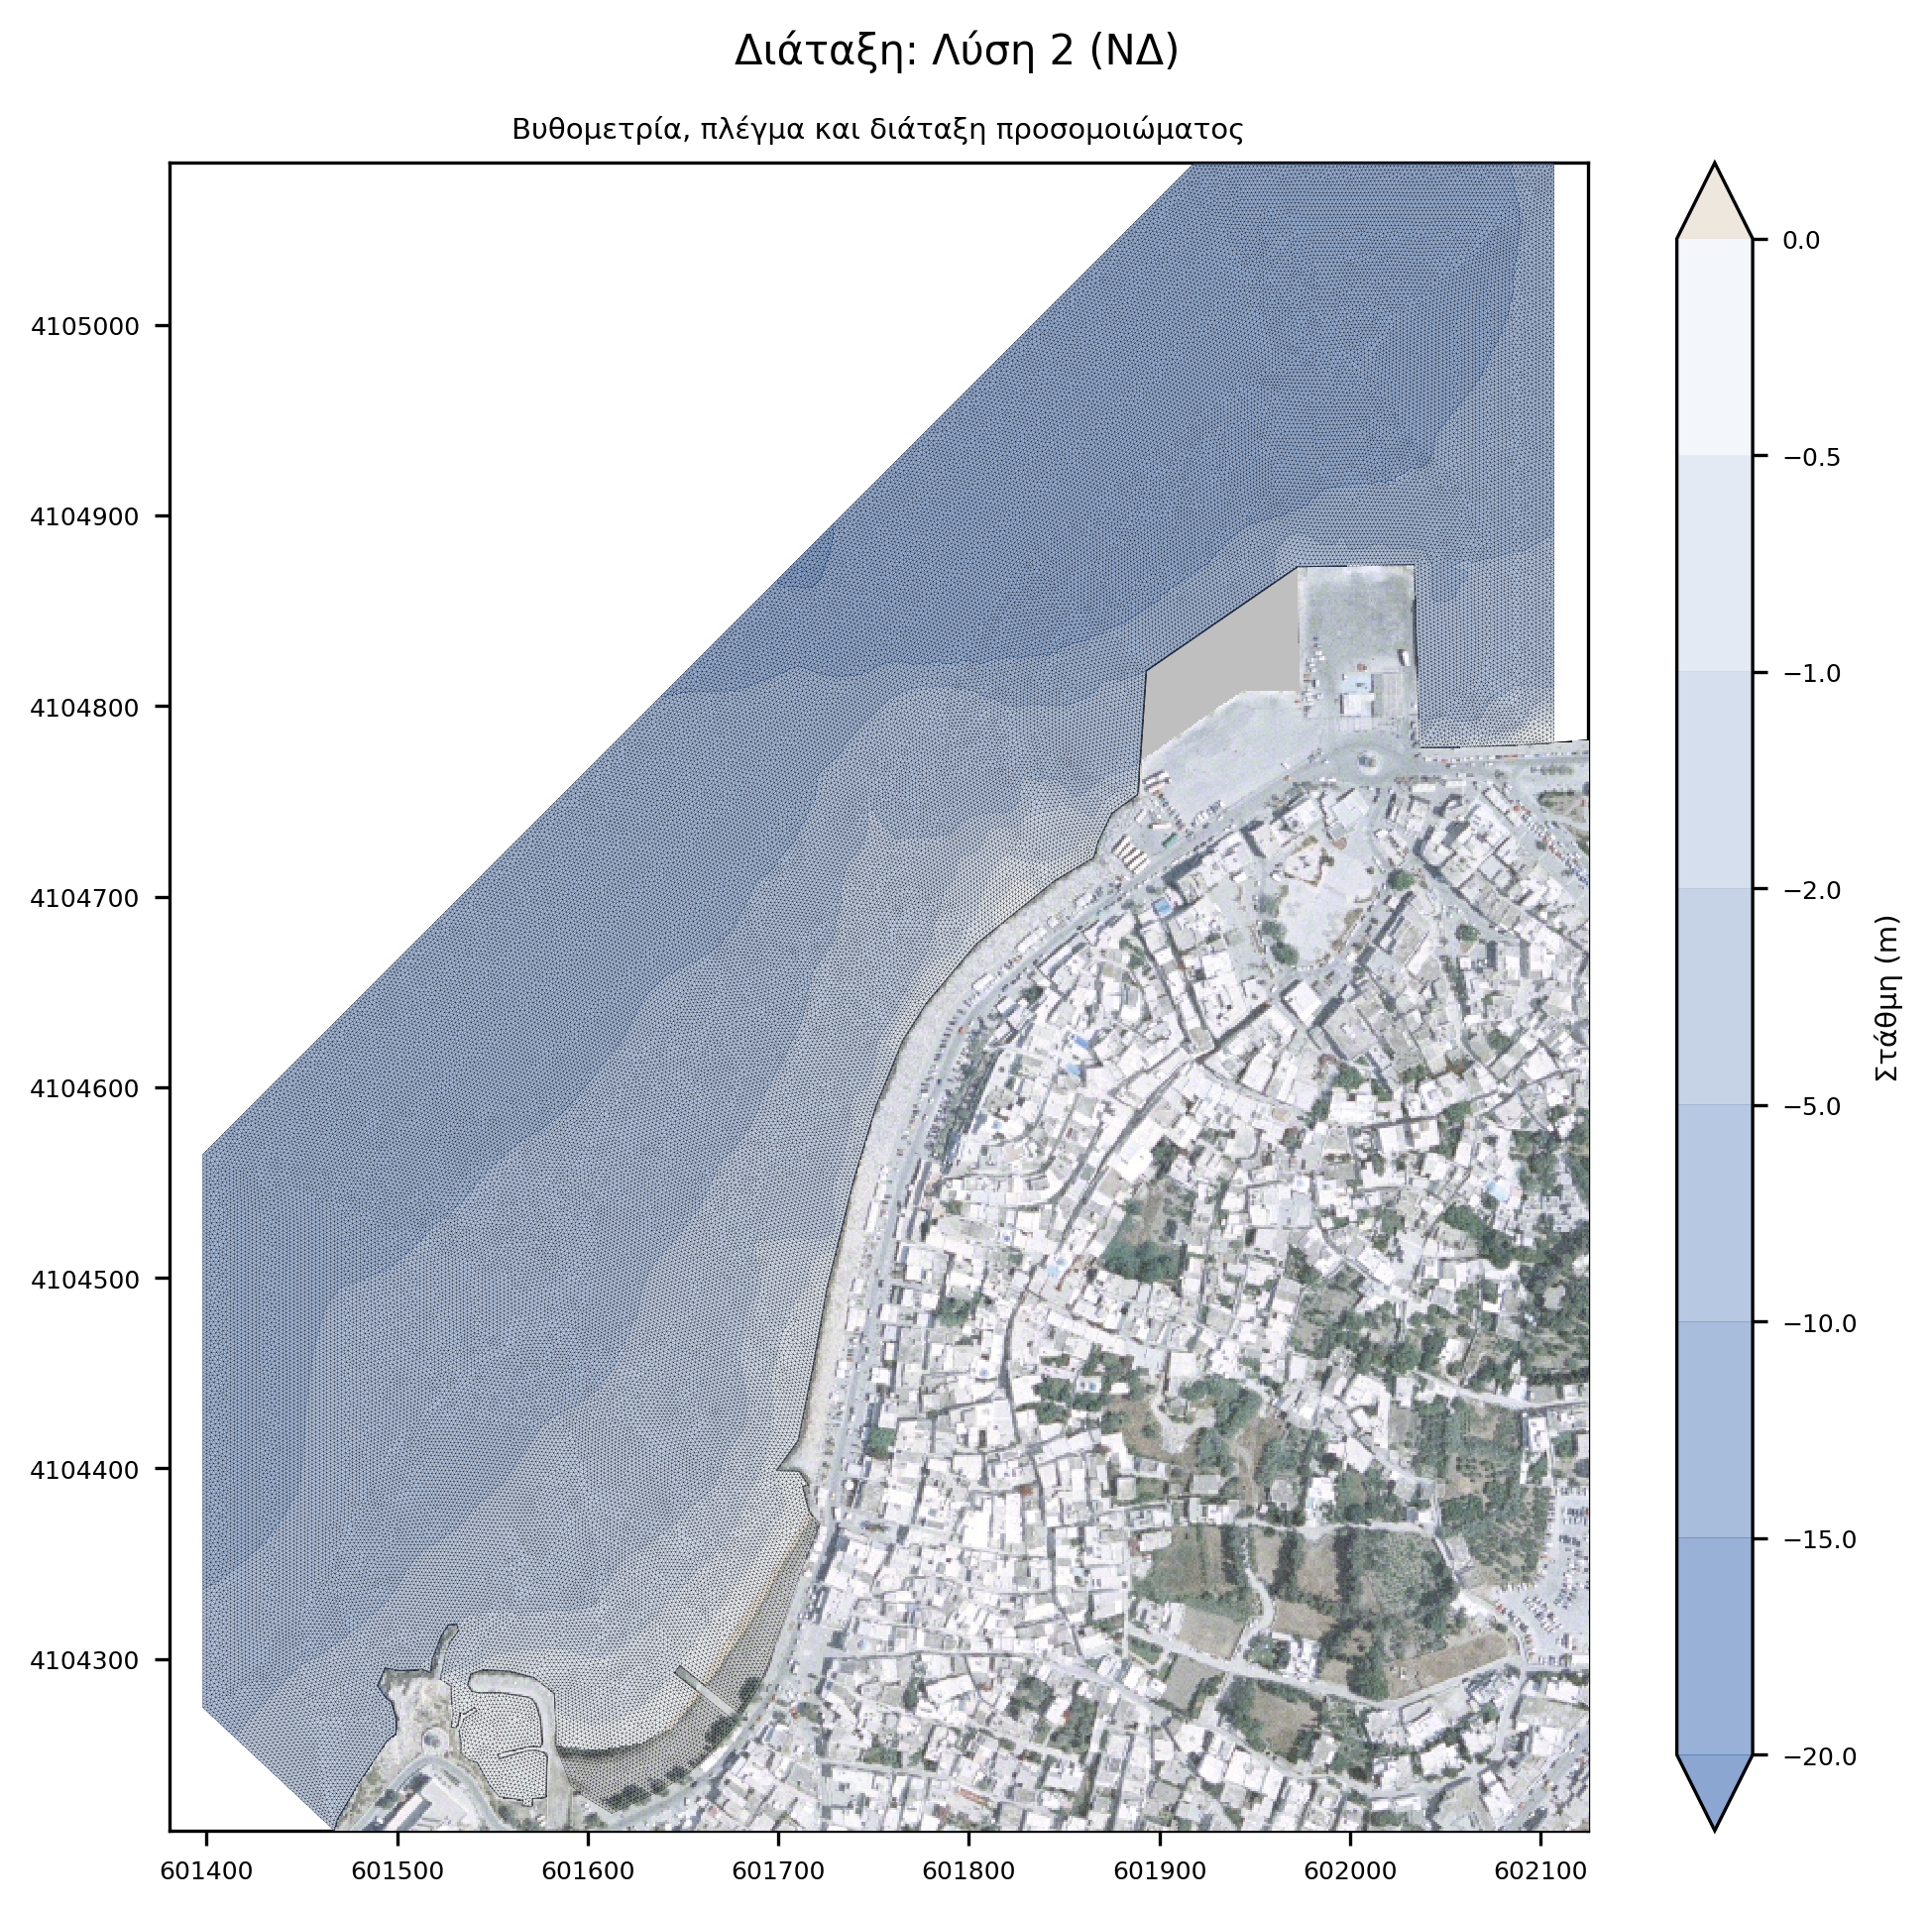
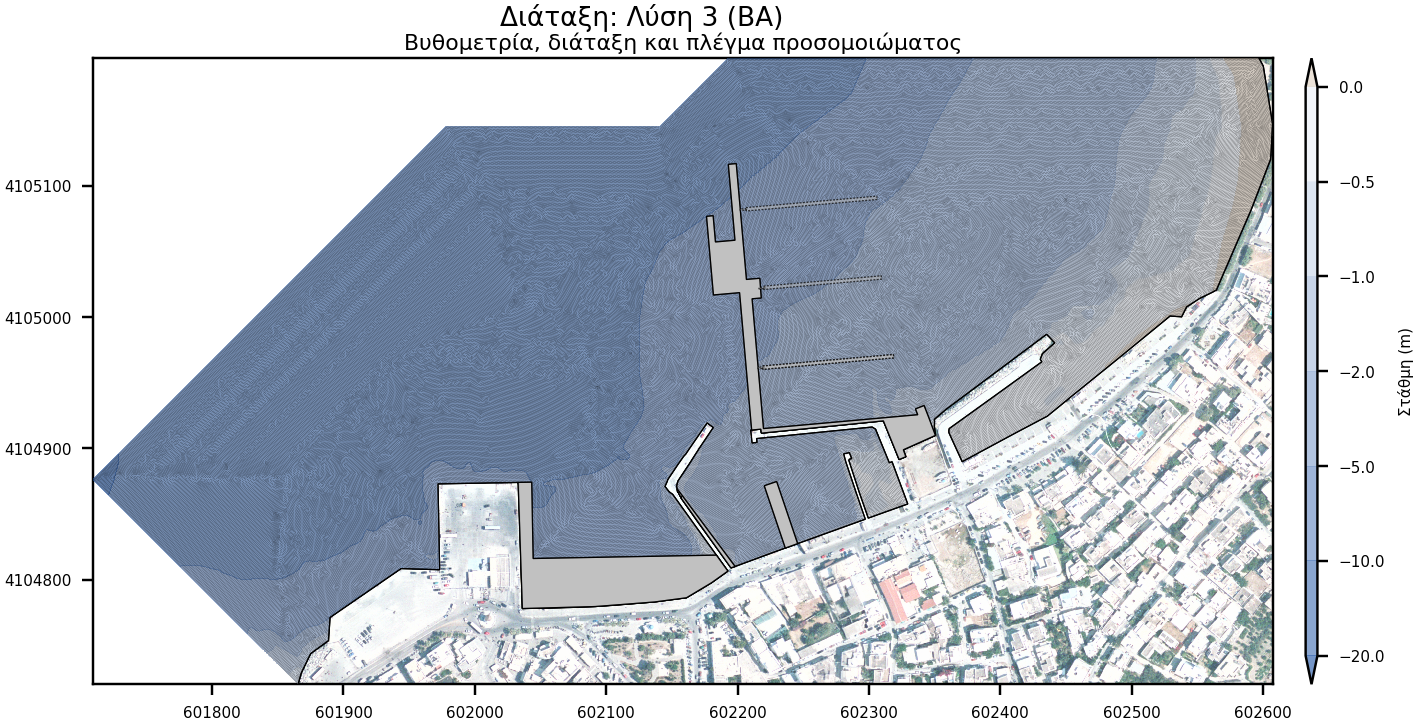
Wave disturbance model
The model domain was divided into two (2) sub-domains, namely, the southwest (SW) and the northeast (NE). Due to their location, the former is subject to higher wave exposure compared to the latter which is more sheltered.
- SW domain: It extends 1000 meters along the SW-axis and 400 meters laterally. It covers an area of about 0.26 km2 and consists of about 140,000 elements and 70,000 nodes.
- NE domain: It extends 950 meters along the W-axis and 400 meters laterally. It covers an area of about 0.21 km2 and consists of about 112,000 elements and 56,000 nodes.


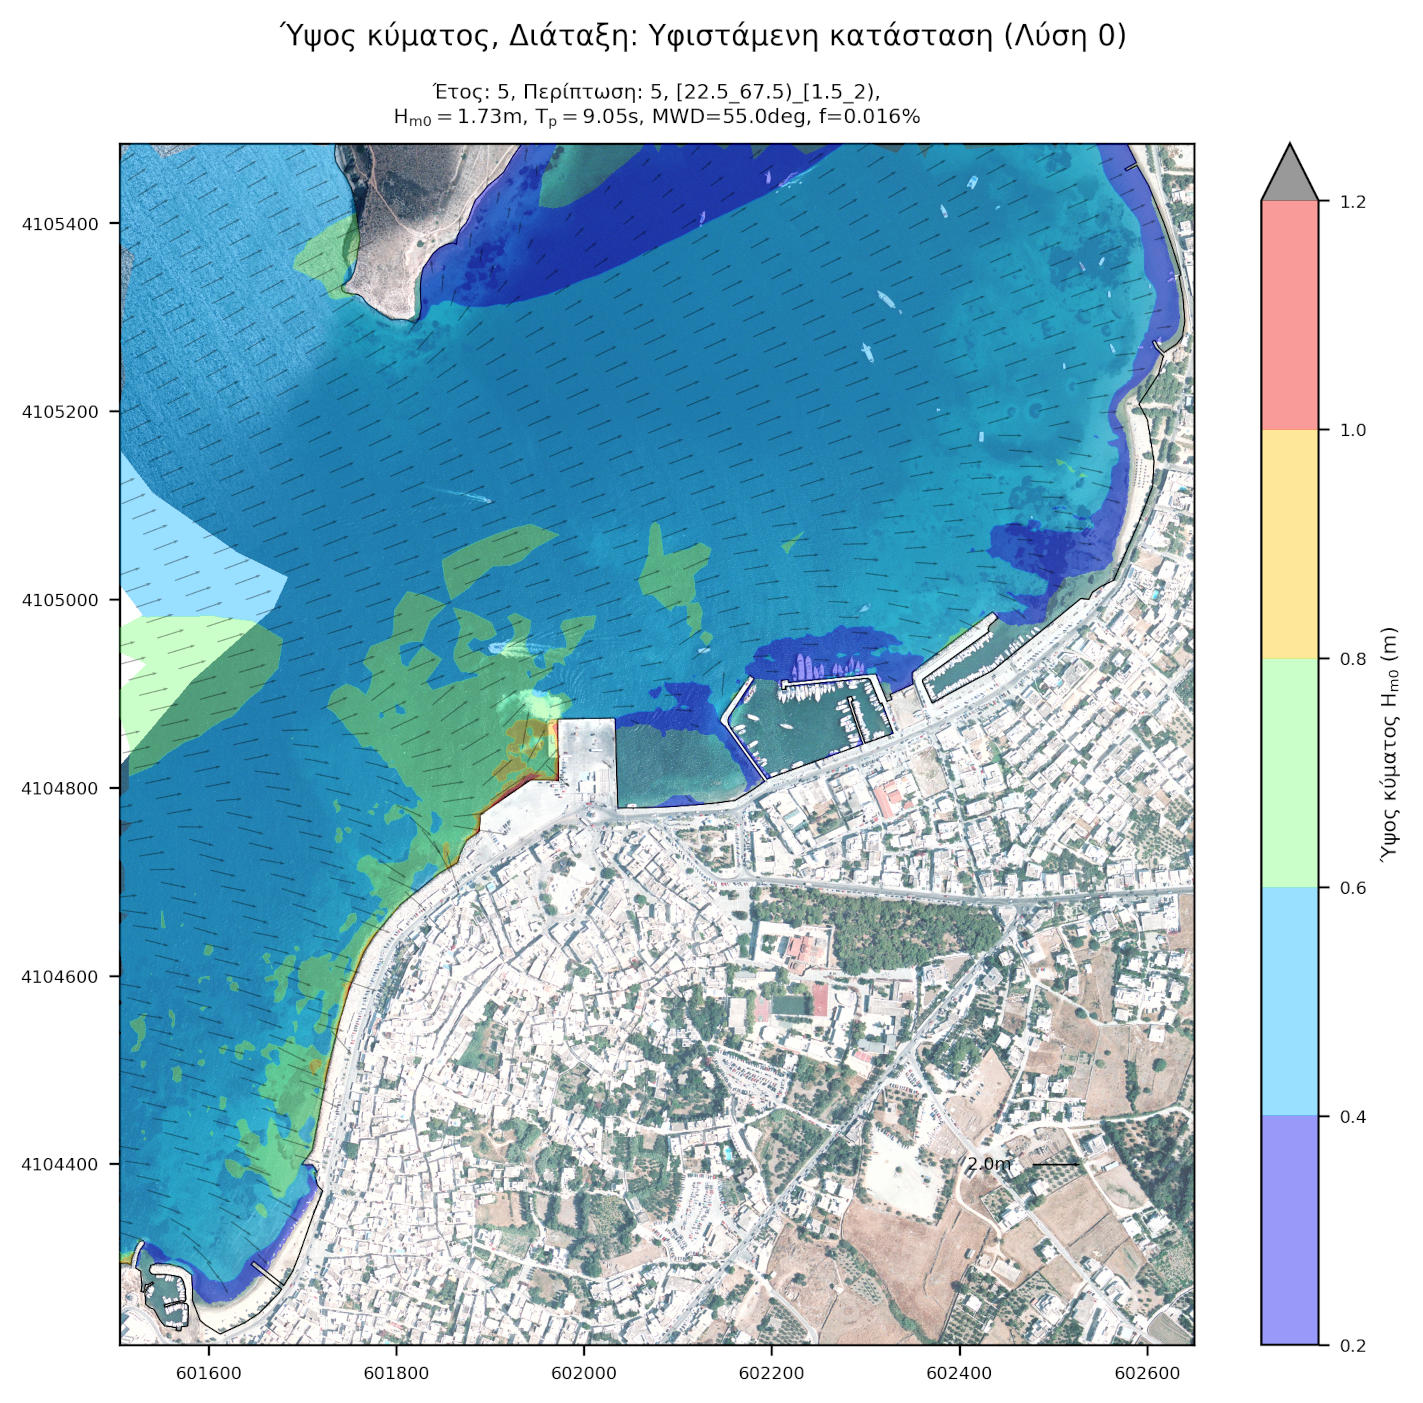
Wave climate
Wave and wind data were derived from the WAMC4 and Skiron/Eta forecast model. Two nodes are located offshore with coordinates as shown below:
- Node 222, latitude of 37.050 and longitude of 25.050
- Node 223, latitude of 37.100 and longitude of 25.100
Node 222 and 223 is located 4,8 and 9,8 kilometers away from the project site respectively. The duration of the dataset covers the period between 2001 and 2010.
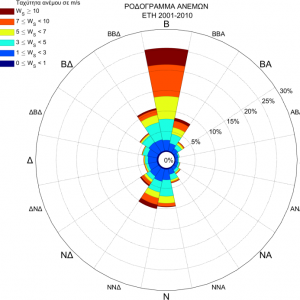
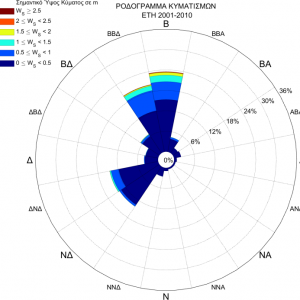
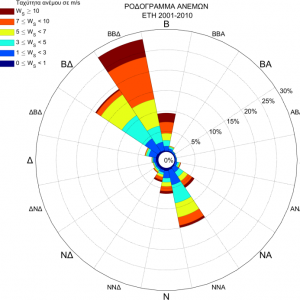
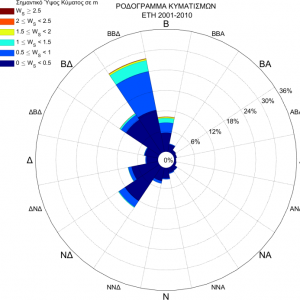
Initially, wave directions were divided into 45 ° sectors and wave height values were divided into 0.5 meter bins. Very low waves were excluded while very high were aggregated due to the very low frequency of occurrence.
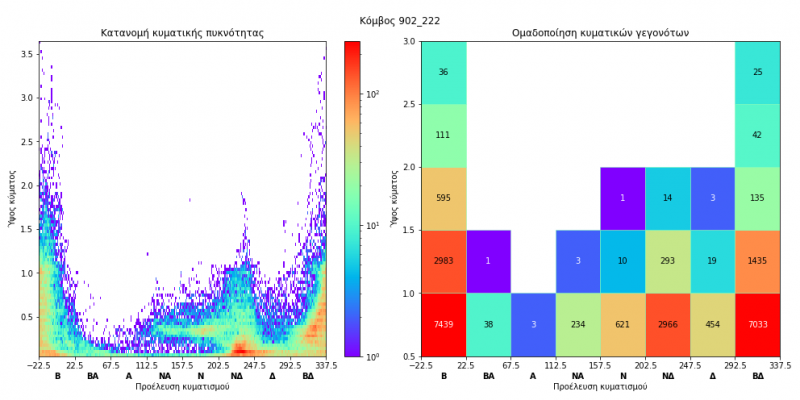
Subsequently, the directional sectors that did not affect the study area were excluded. For the remaining directional sector-wave bin combinations, the equivalent wave height (representative of the wave state on a yearly basis) was calculated.
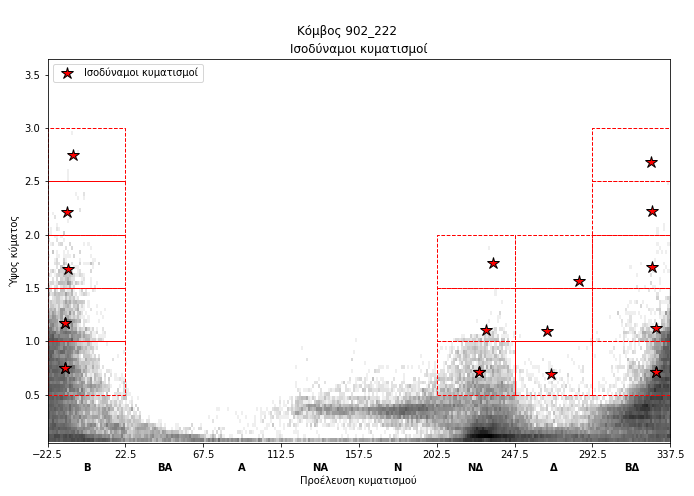
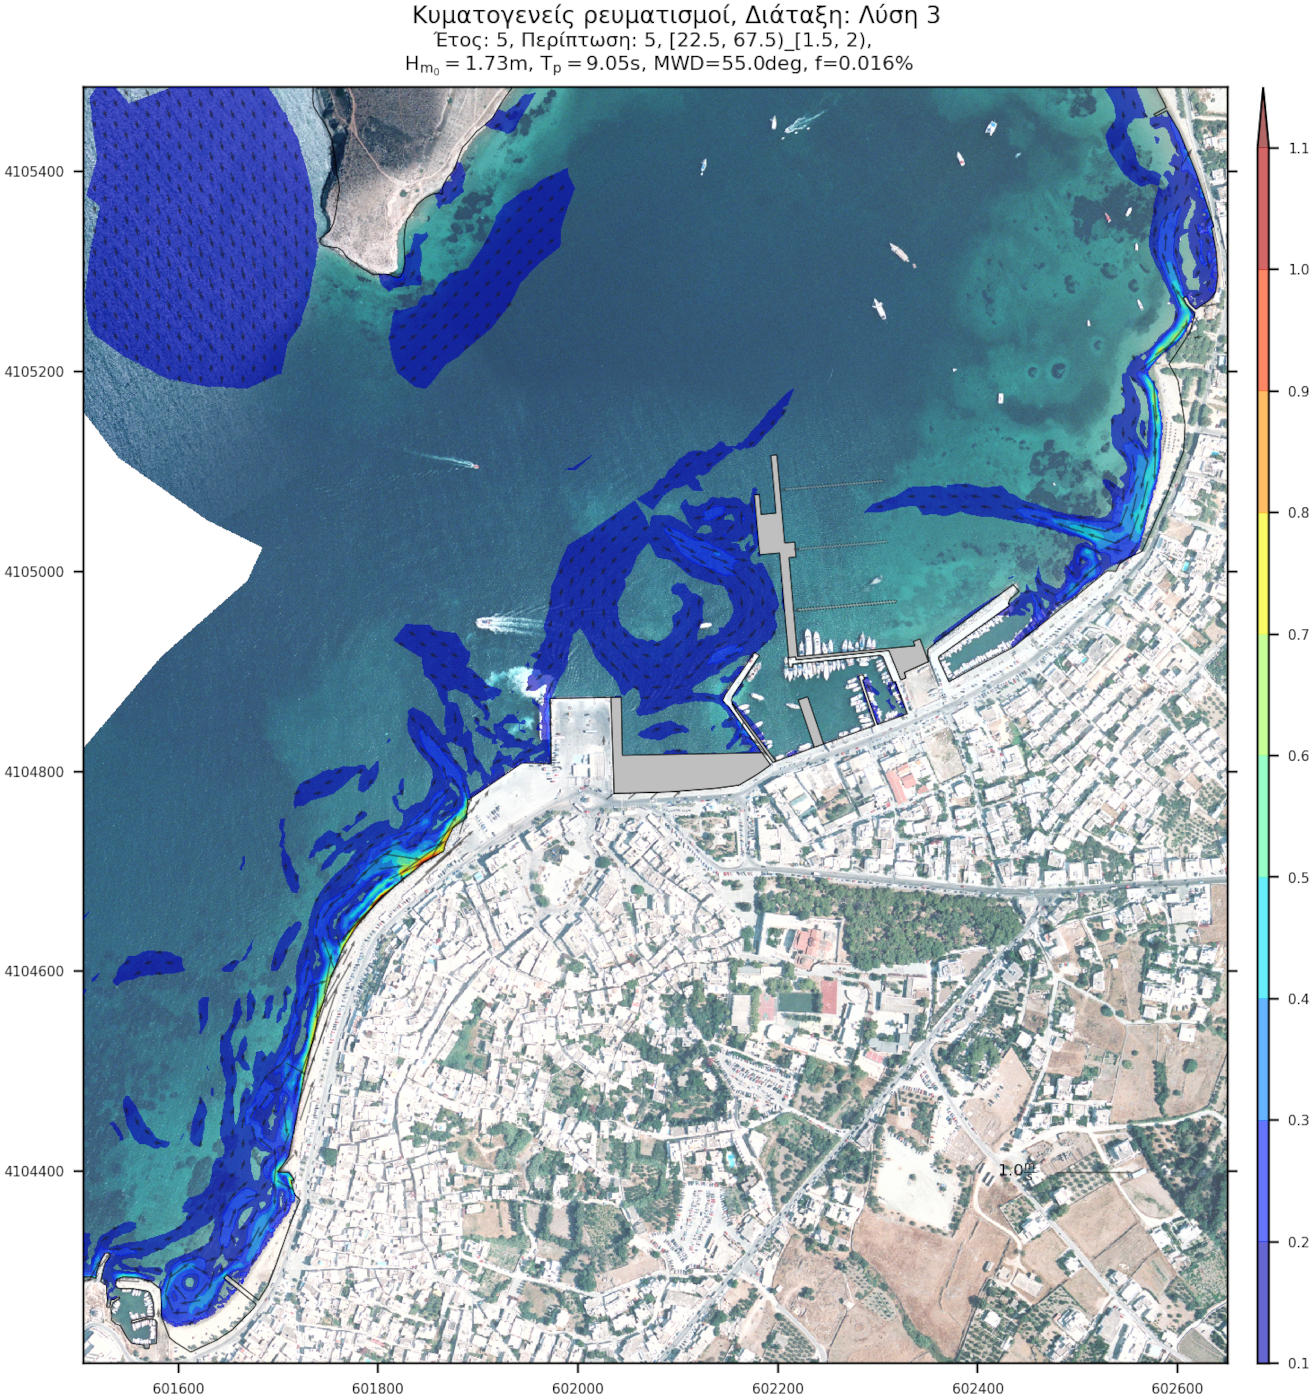
The wave cases were examined sequentially so that changes in bottom morphology are taken into account in the next case. The procedure was repeated 5 times, to simulate bottom change over 5 years.
Conclusion
According to the findings of the coastal investigation and the results of the numerical simulation, the area under consideration has relatively reduced sediment transport activity.
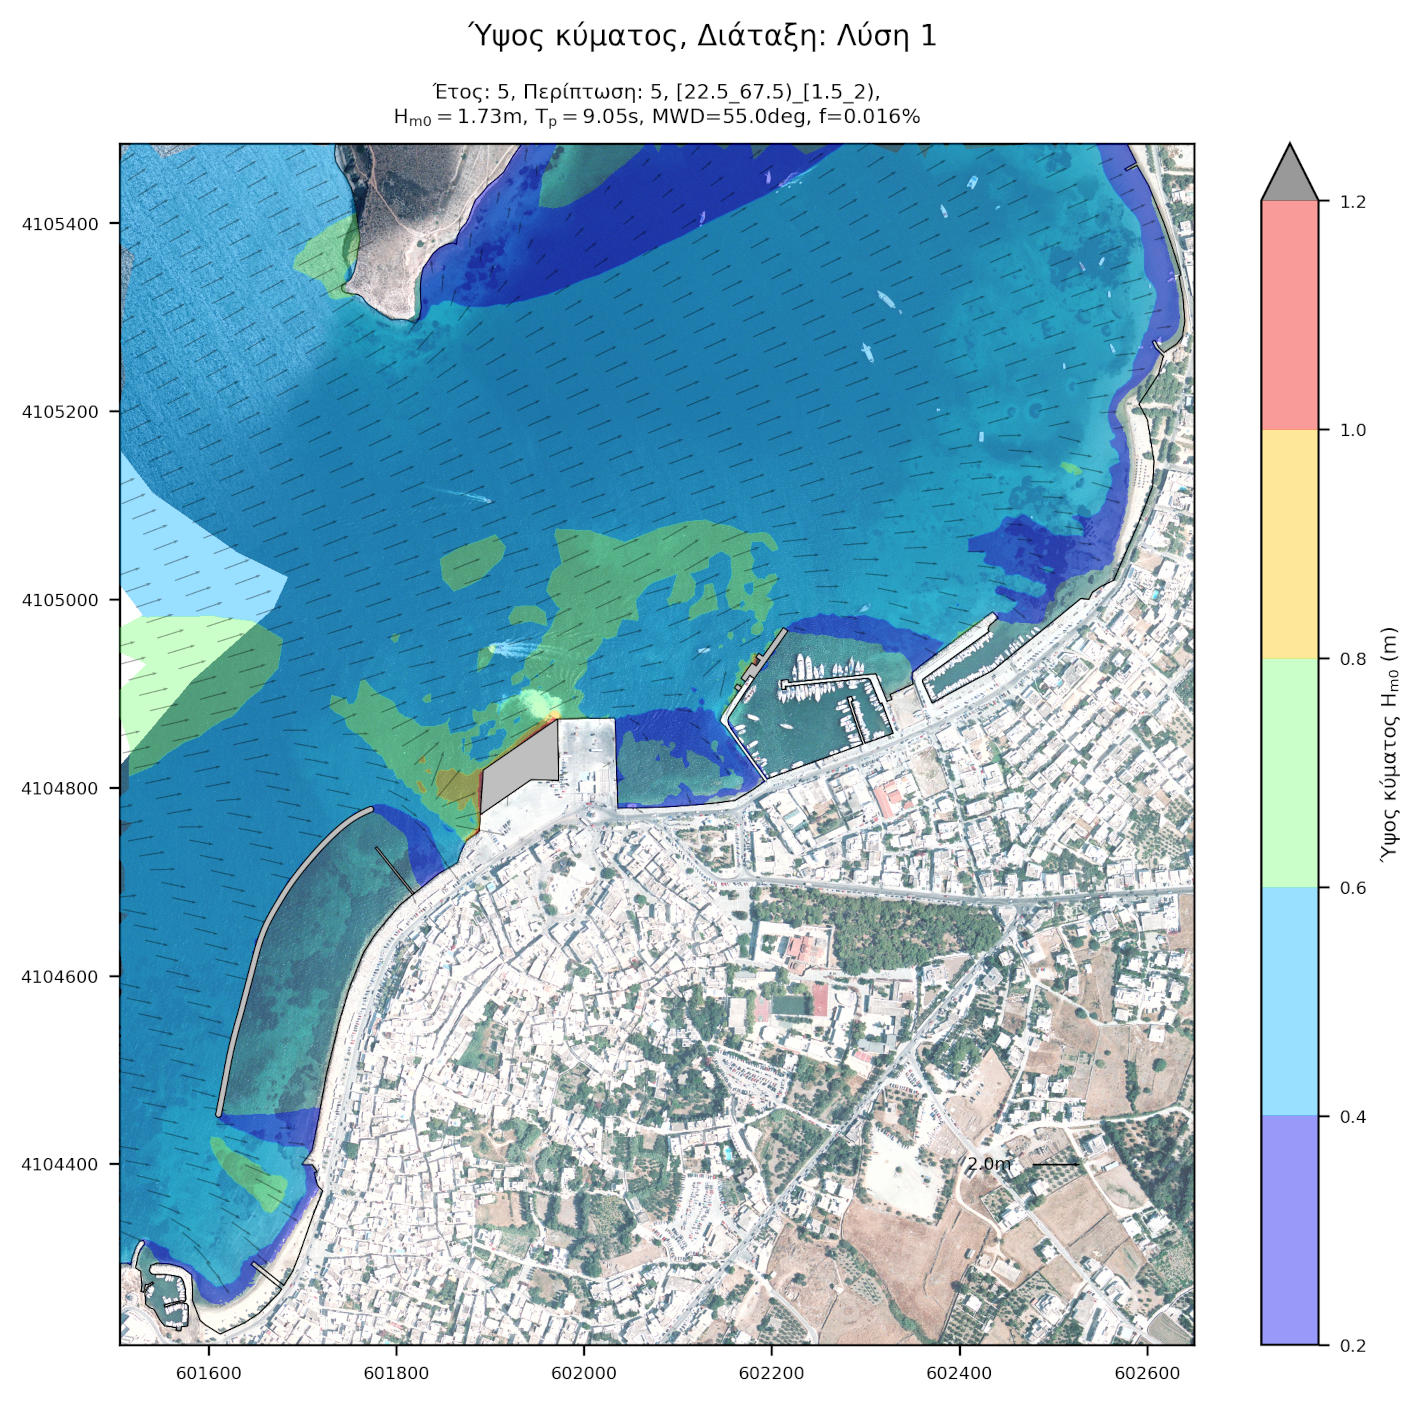
The beach to the SW remains unaffected by the proposed works (Layout 3). The beach/coastline leeward of the works is sheltered to a large extent however it is prone to erosion due to the lack of sediment availability. Layouts 2 and 3 are equally accumulating sediment at their lee where erosion is currently observed and thus counteract erosion.