

The design of a port is primarily aimed to provide suitable berthing conditions for the ships. Each ship or craft, depending on its size and type (RoPax, cruise ship, cargo, fishing, recreational, etc.) can bear a maximum disturbance before it can't operate or stops fulfilling its purpose. In central ports, where multiple purposes coexist, provision of required mooring conditions becomes a problem of many parameters.
Numerical simulation of wave disturbance is a tool to aid the engineer to lay out external works and set the uses of a port. However, interpreting and exploiting simulation results to optimize the layout is a challenge. Raw data, at first glance, offers a qualitative analysis and alone is incapable of leading to safe conclusions.
Our experience in conducting wave disturbance studies has shown that the most appropriate solution is to statistically analyze the characteristics of disturbance and derive indicators that are easier to interpret/assimilate. This article gives an impression of the technique we employ in a wave disturbance study, focusing on the particular problem of quantitative evaluation.
The article shows results from the Wave Disturbance Study of the port of Karpathos.
Wave cases examined
Selecting appropriate wave conditions to be applied in the mathematical simulation is a particularly important step as they directly affect the results of the calculations, and hence the design parameters of the projects.
Climate data sourcing
Wave and wind data are derived from the WAMC4 and Skiron/Eta [1] forecast model from node 946_192 with latitude and longitude 35.50o, 27.25o. The location is 3.3 kilometers away from the project site. The duration of the data covers the period from 1-1-1996 to 31-12-2015.
SKIRON/Eta forecasting model
The core of the WAM forecasting wave model is the SKIRON/Eta atmospheric model. The model is configured so that it takes into account the intense topographic terrain that characterizes the Greek territory with the introduction of an ETA vertical coordinate system. It uses equations based on the hydrostatic approximation, which solve mass, energy and entropy while resolving accurately the actual atmospheric conditions. The results of the atmospheric model have hourly analysis and include Cartesian components of wind, air density, atmospheric pressure, temperature and specific humidity for atmospheric levels of 10, 40, 80, 120 and 180 meters above sea surface.
WAM (CYCLE 4) wave forecasting model
The forecasting of wave conditions is made using the "WAM CYCLE 4" model as configured by the ECMWF (European Center for Medium-Range Weather Forecasts). The model has the ability to solve the wave energy transmission equations without limiting the spectral shape, while internally maintaining the system energy and allowing the non-linear interaction of the waves. It is considered to be the most widespread and validated wave forecasting model. It calculates in statistical terms and hourly the height, mean direction, and frequency of significant wave height (Hm0) of wind-generated waves and swell. The model results are validated by the use of satellite observations (Satellite LIDAR) as well as by marine buoys (Poseidon Measurement Network).
Windwave climate
From the following graphs, the first two shows the average annual wind and wave roses while the next two shows the wave conditions from May to September "summer season" and October to April "winter period".
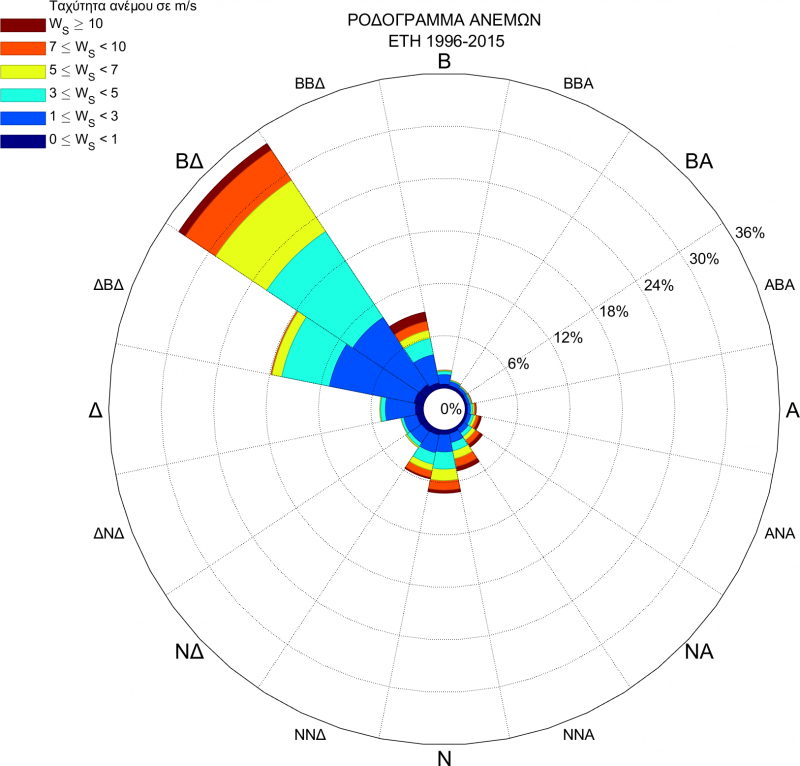
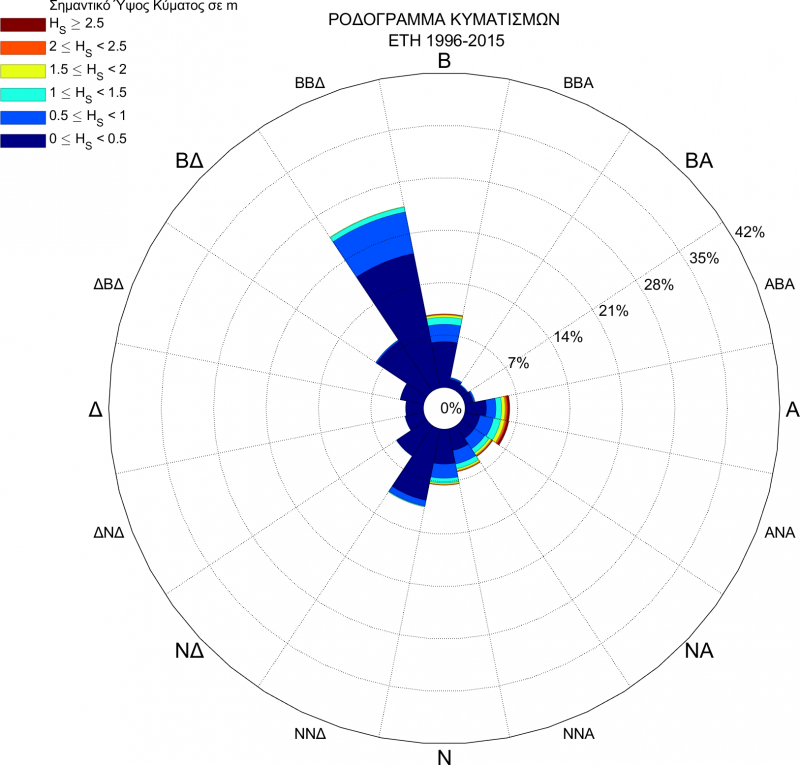
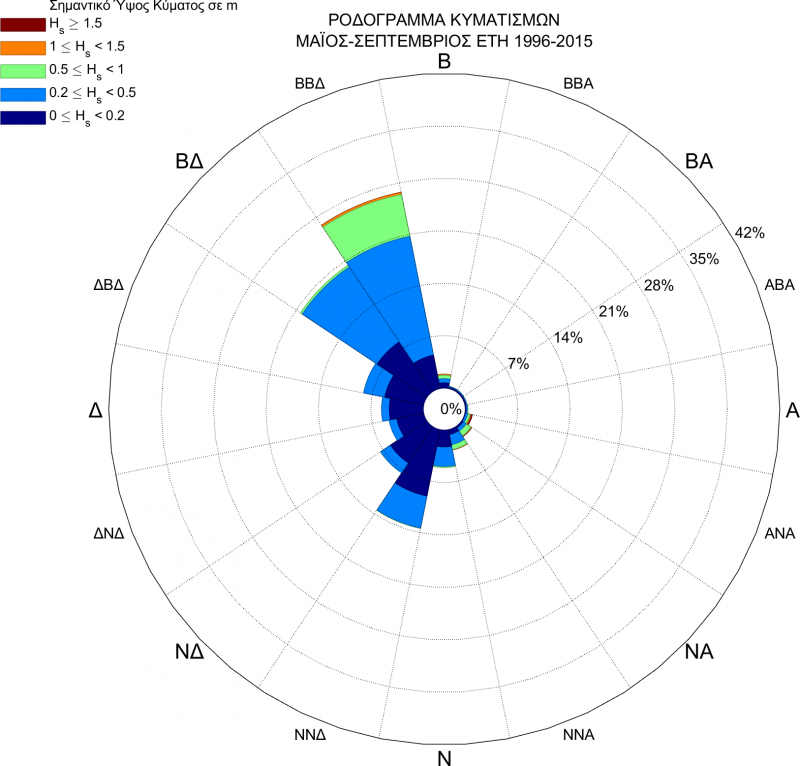
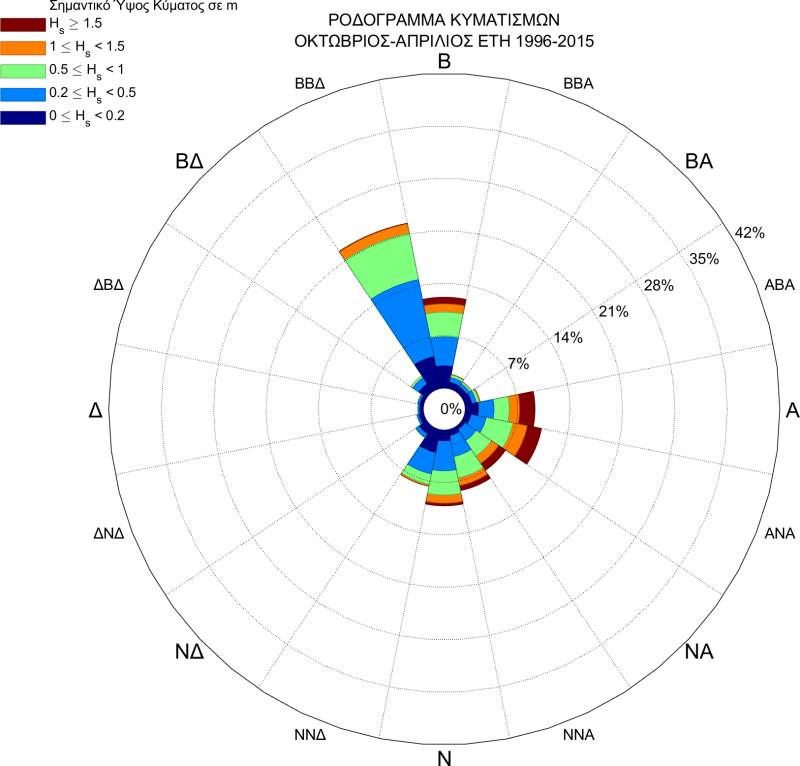
Usually (including this case, as can be seen from seasonal waveroses), the wave climate varies widely between winter and summer, with annual wave events not reflecting the much calmer summer conditions. As a result, the wave cases considered were calculated for both the whole year and only the "summer season" (May to September) alone. In ports where ideal conditions cannot be achieved throughout the year, therefore the objectives are:
- During summer period, when the port is operating at maximum capacity, to provide the maximum percentage of operating quay walls.
- During winter period, when the port is operating under light load, to provide a minimum percentage of operating quay walls for shelter in bad weather.
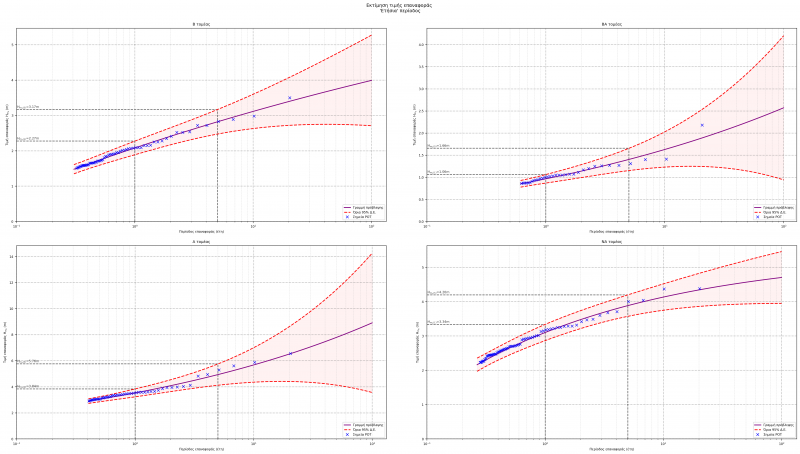
Extreme value analysis
The most appropriate approach is the statistical processing of climatic data to forecast wave events that will occur once within a time period. The statistical method used is Extreme Value Analysis and more specifically, the POT (Peak Over Threshold) method. Considering the chart obtained from the analysis, the wave height values corresponding to 1 and 5 years return periods were selected for the study.
Numerical models employed
The software package used for the wave penetration and disturbance study was the TMS (Telemac-Mascaret System). The spectral wave model "TOMAWAC" was applied to simulate the propagation of wave conditions from the node of the WAMC4 offshore model up to the project location and the "ARTEMIS" model based on the solution of "elliptic equations" for the estimation of wave disturbance.
Application
The overall simulation is usually performed by two separate models, the offshore and the wave disturbance model. The former extends from the position of offshore wave conditions (the node of the WAM wave model) up to the shore, and its role is to define the boundary conditions for the wave disturbance model.
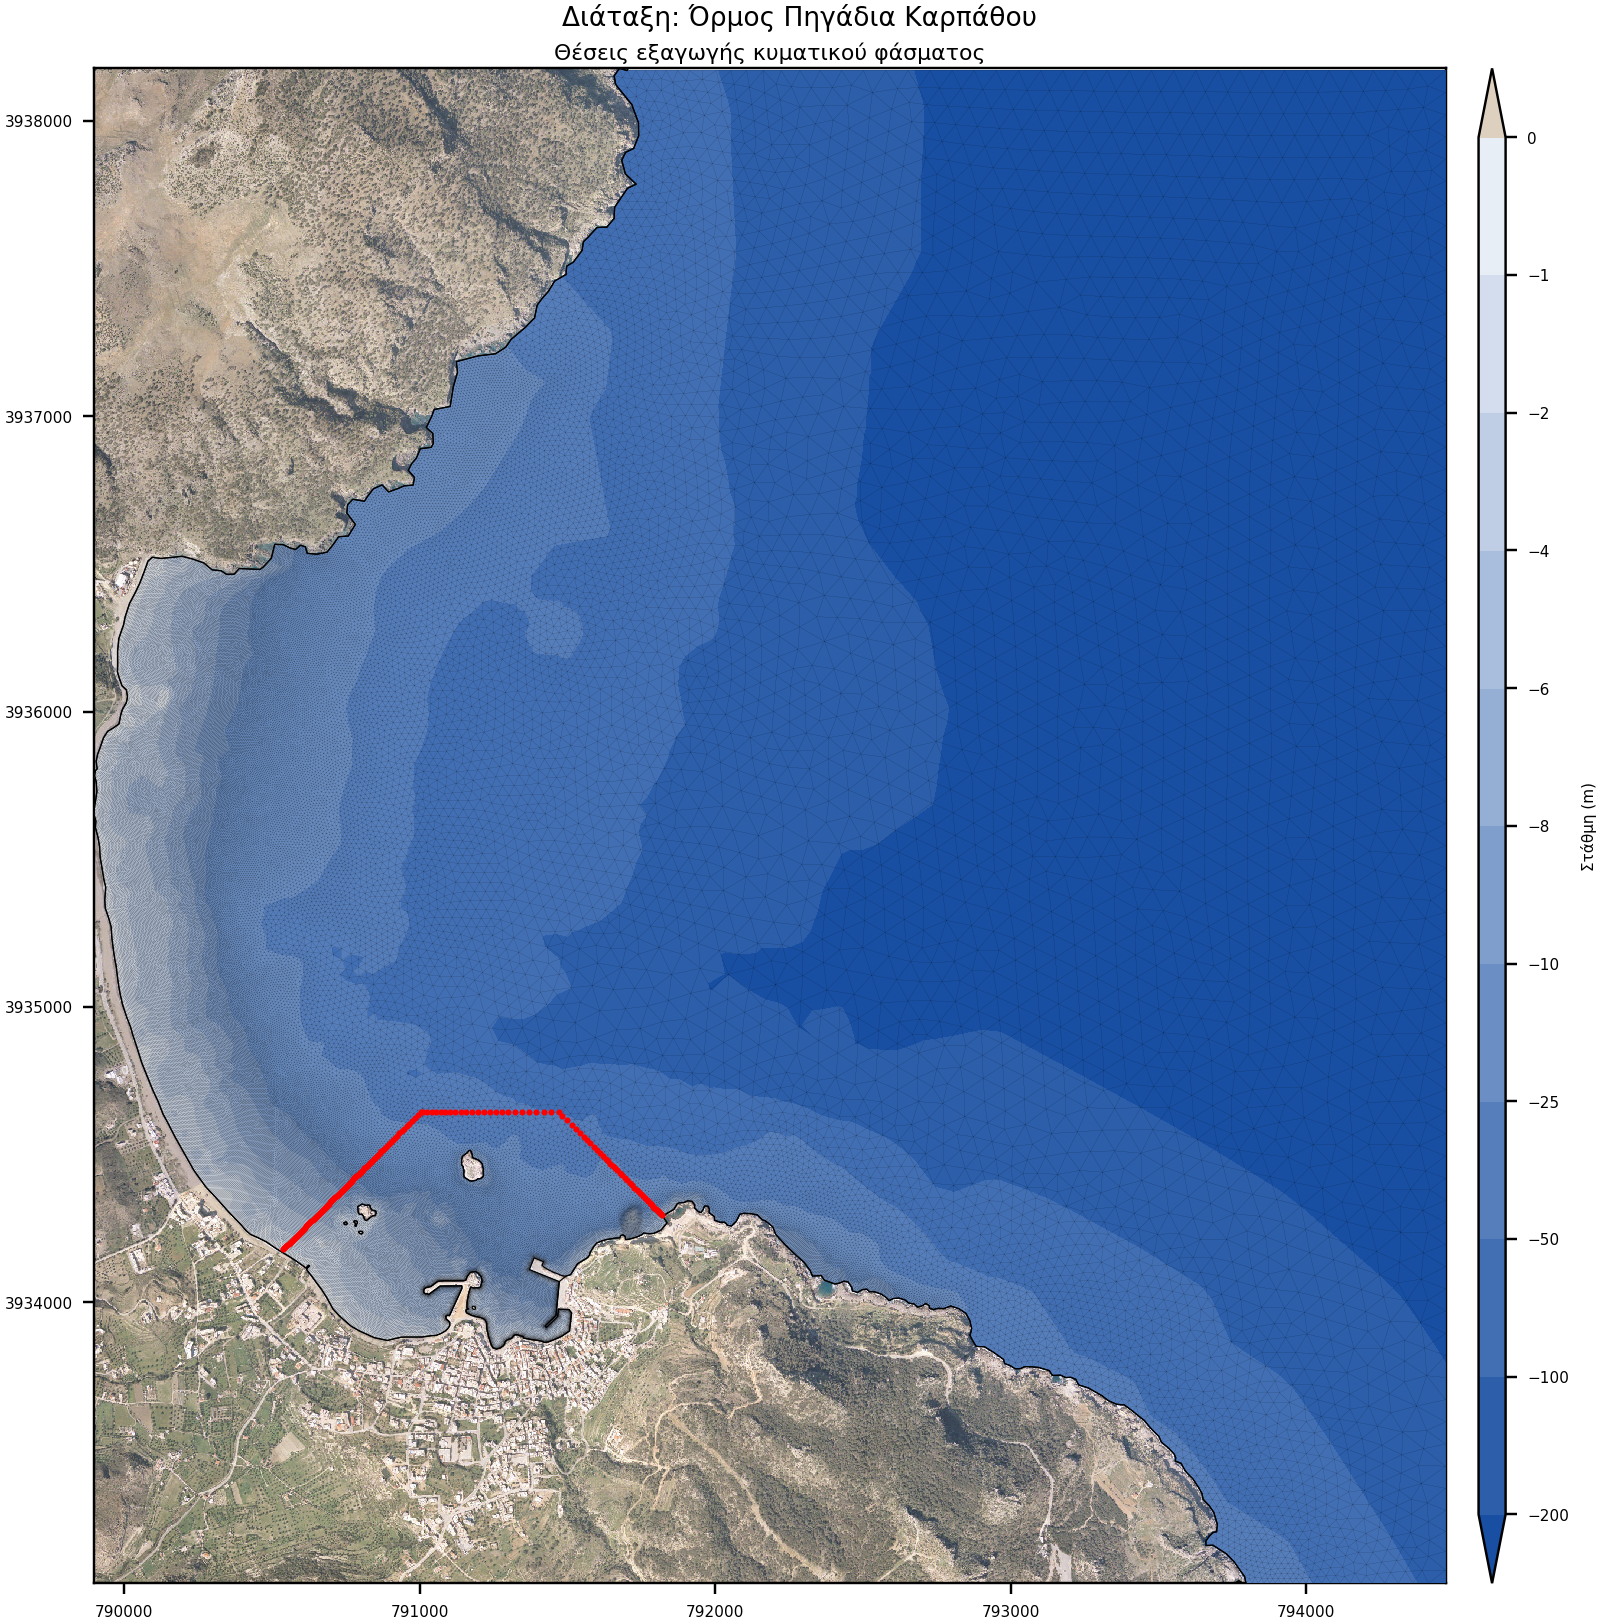
- Offshore simulation: It extends 5.1 km along the N-axis and 4.6 km laterally. It covers an area of approximately 17.1 km2 and consists of 177,000 elements and 90,000 nodes.
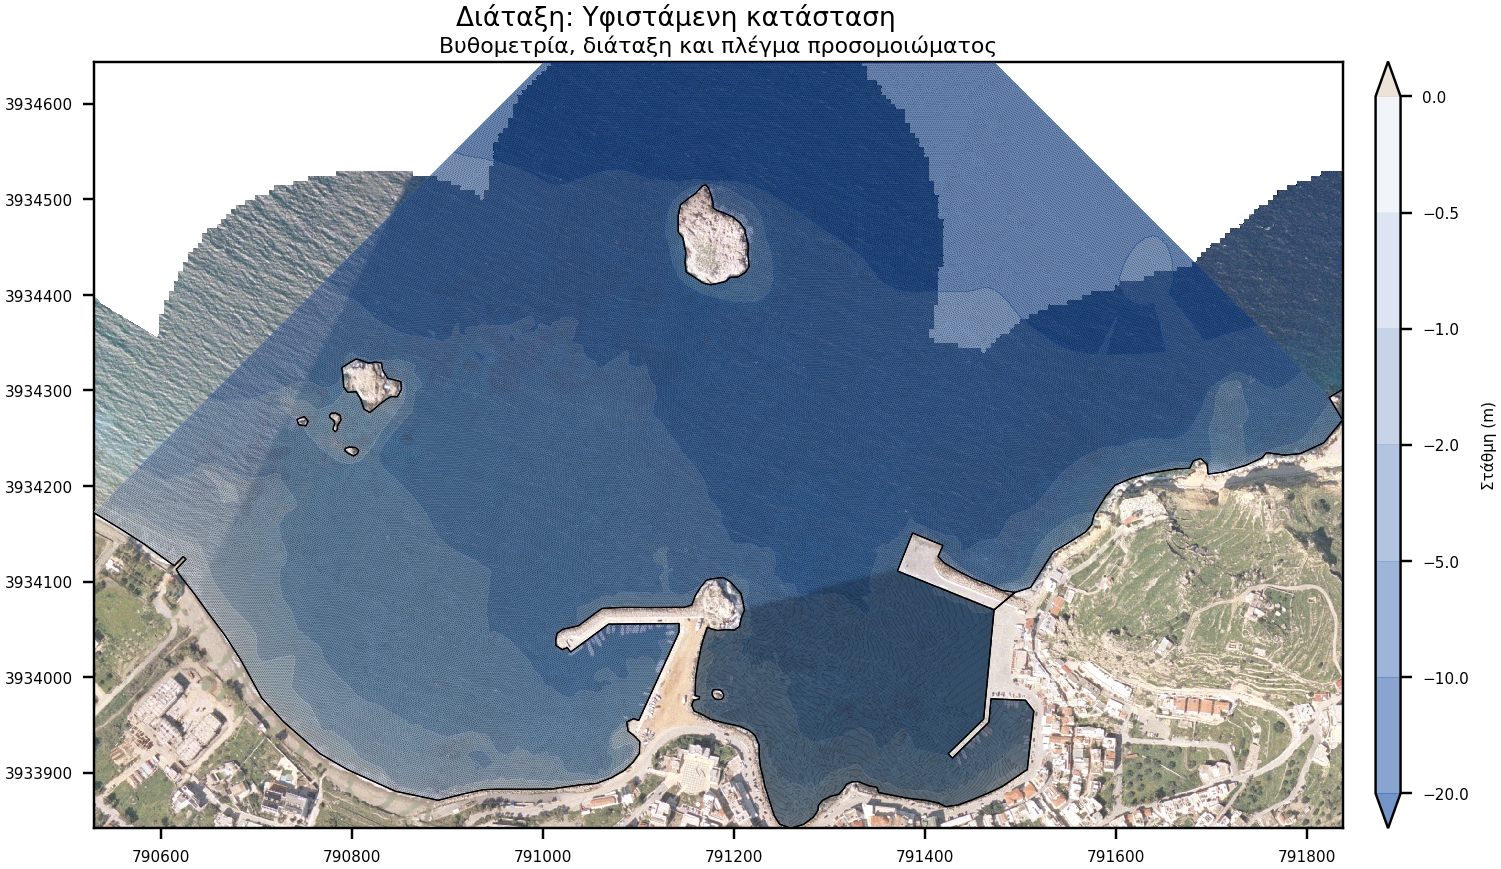
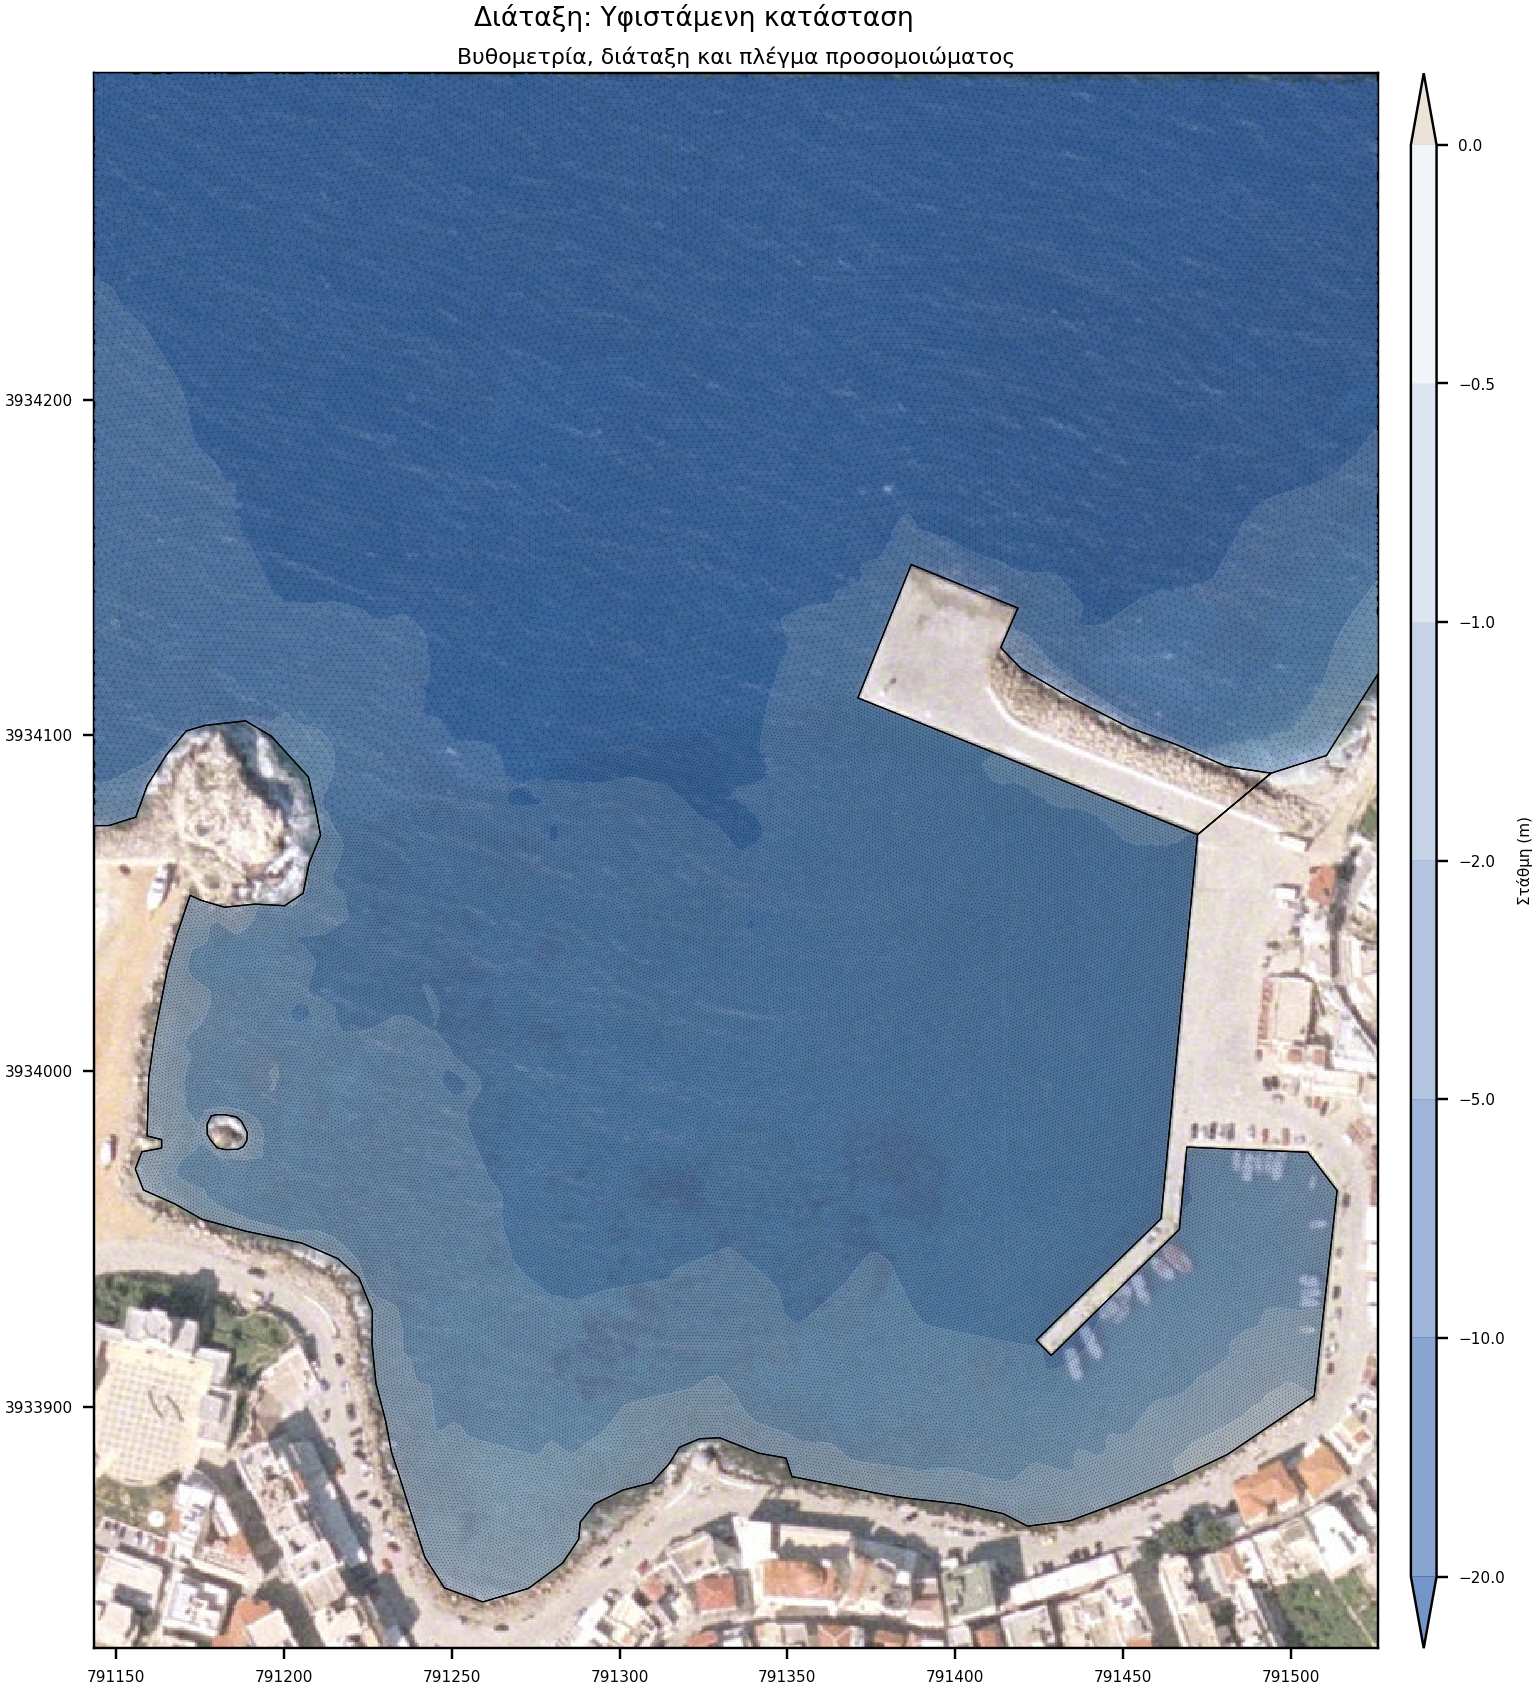
- Wave disturbance simulation: It extends 1300 m along the DA axis and 800 m laterally. It covers an area of about 645 acres. and consists approximately 445,000 elements and 224,000 nodes.
A total of 20 wave cases corresponding to 100 simulations were examined, which consists of:
- 20 TOMAWAC simulations to propagate wave conditions from the WAMC4 regional model node to the project location.
- 80 ARTEMIS simulations, for the calculation of wave disturbance, 20 for every wave case, 4 layouts (existing condition and alternatives 1, 2 and 3).
Results
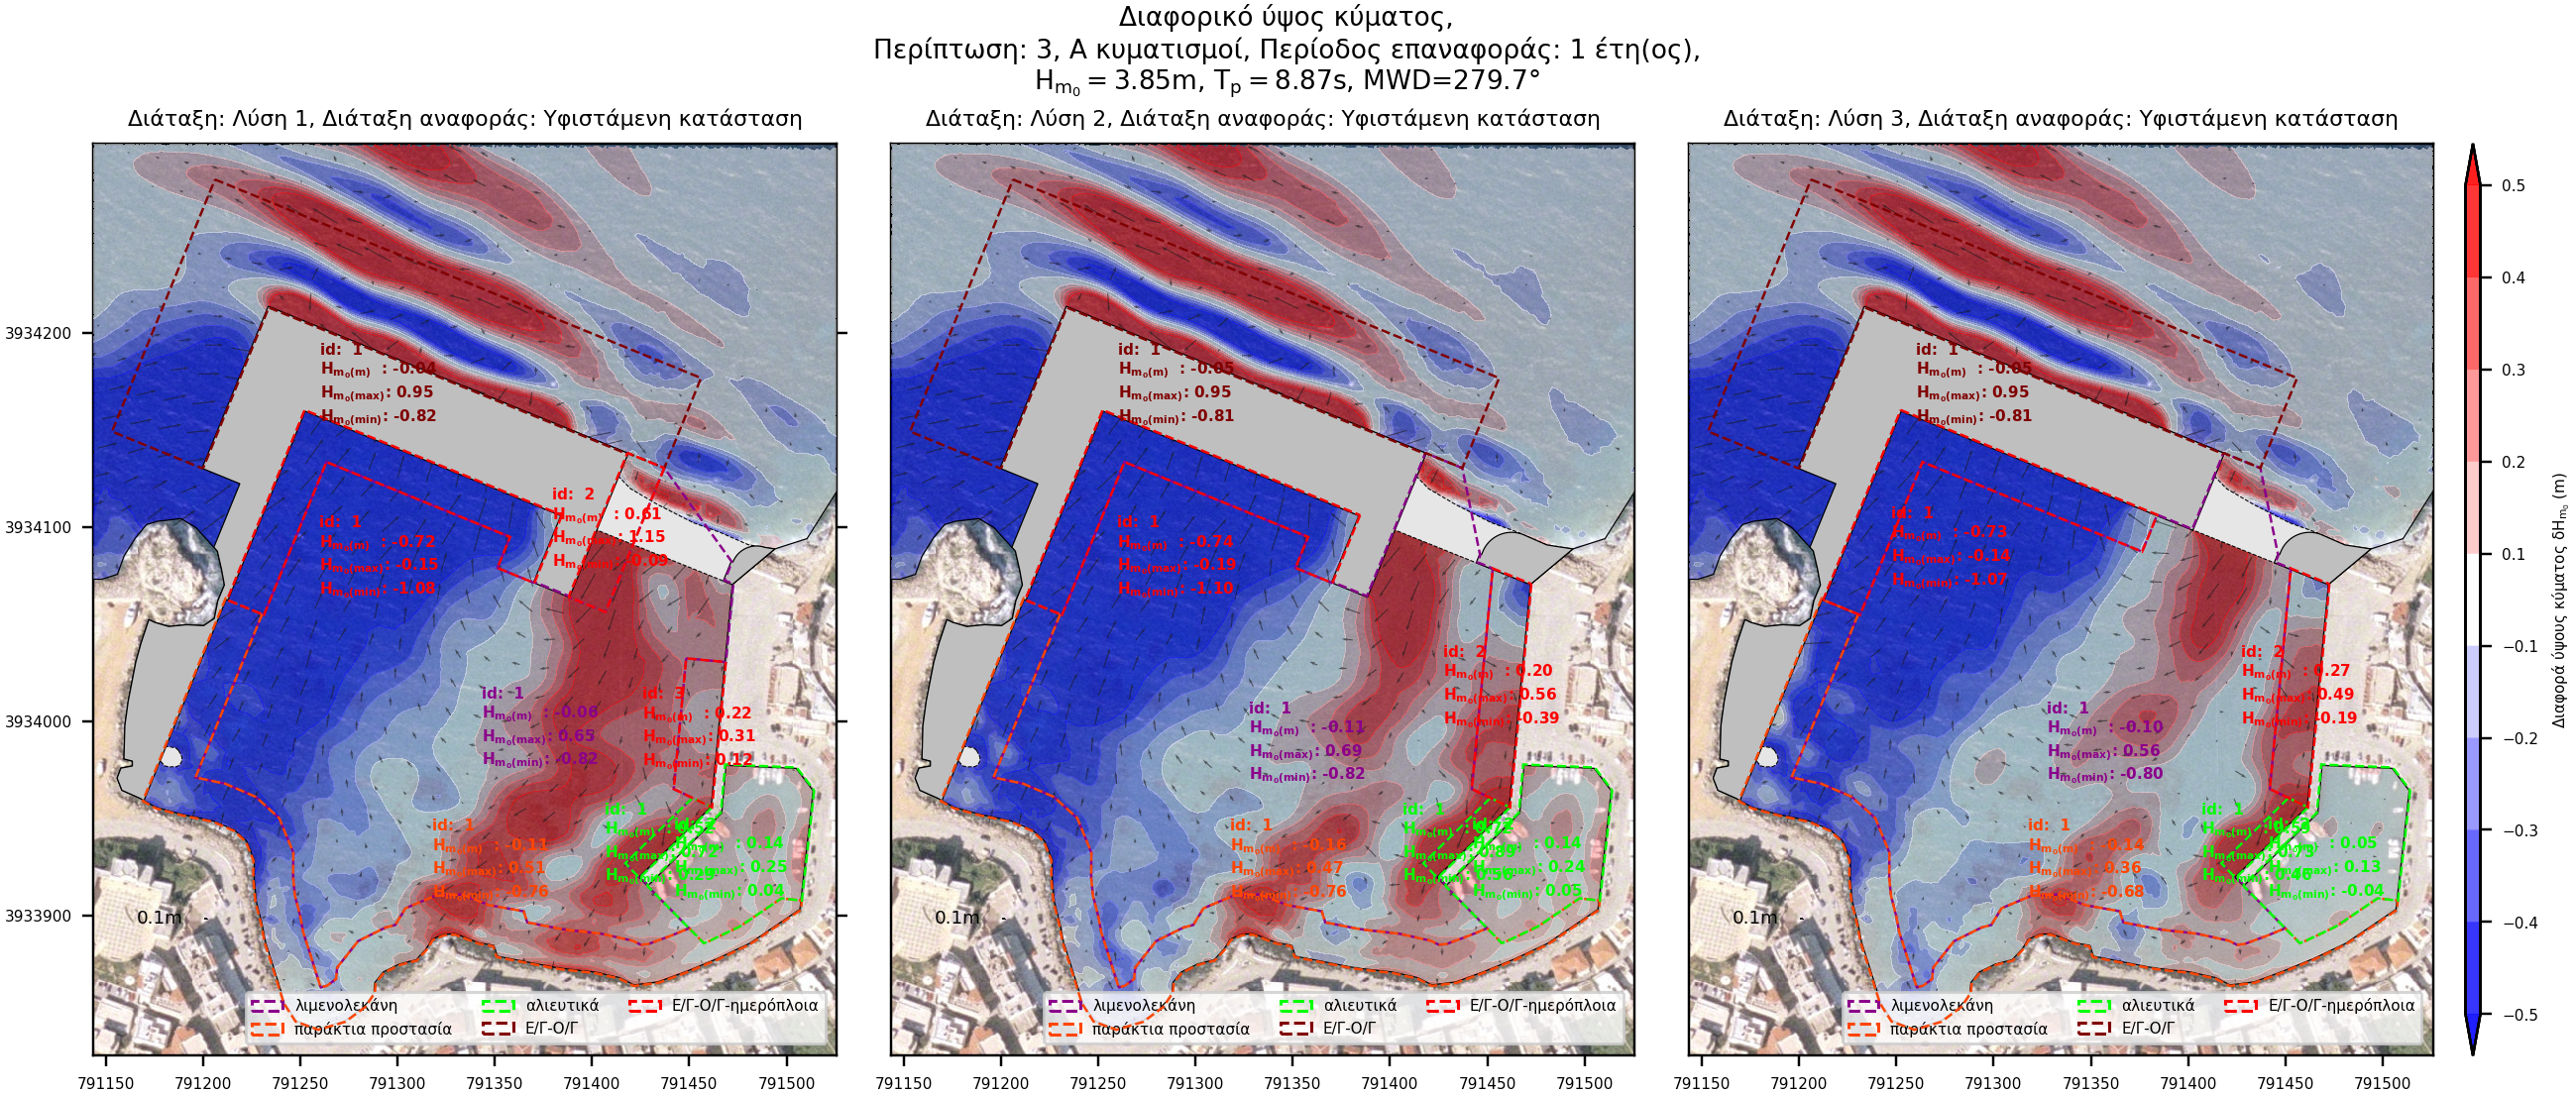
The effectiveness of each alternative is evaluated qualitatively and quantitatively. Qualitative evaluation of wave disturbance is performed by visual inspection of the disturbance maps, on the other hand quantitative is performed by mathematical analysis. There are two types of disturbance maps, absolute and differential disturbance. Differential disturbance graphs are obtained algebraically by subtracting the examined layout from the reference layout disturbance.
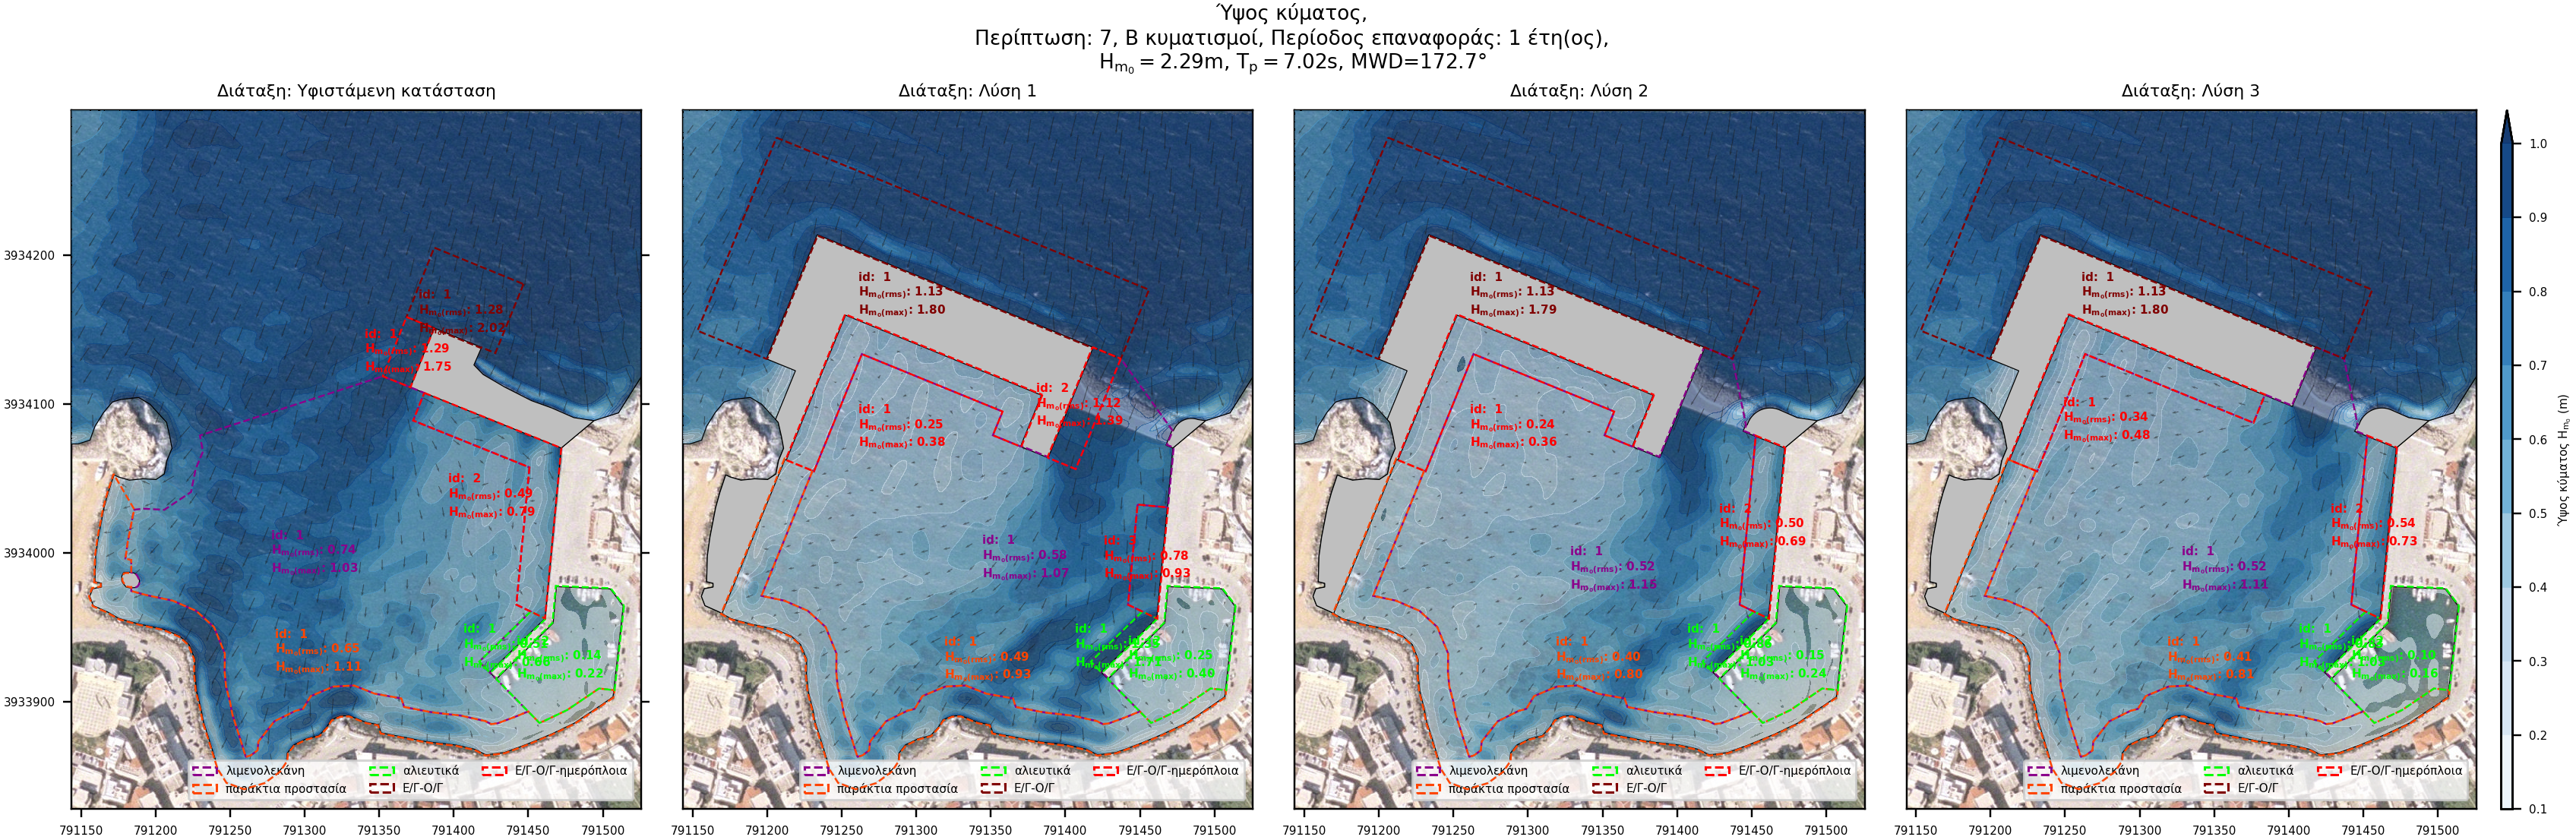
For further analysis and objective comparison of the results, areas of interest have been defined for every layout. For each area, the following parameters have been calculated:
- Active (Ηm0(rms)) and maximum wave height (Hm0(max)) for absolute disturbance and
- Active (Ηm0(rms),), maximum (Hm0(max)) and minimum wave height (Hm0(min)) for differential disturbance
Absolute disturbance plots
The following diagrams, of the absolute wave disturbance, shows the results of each layout for each wave case, as derived from the simulation.

Differential disturbance diagrams
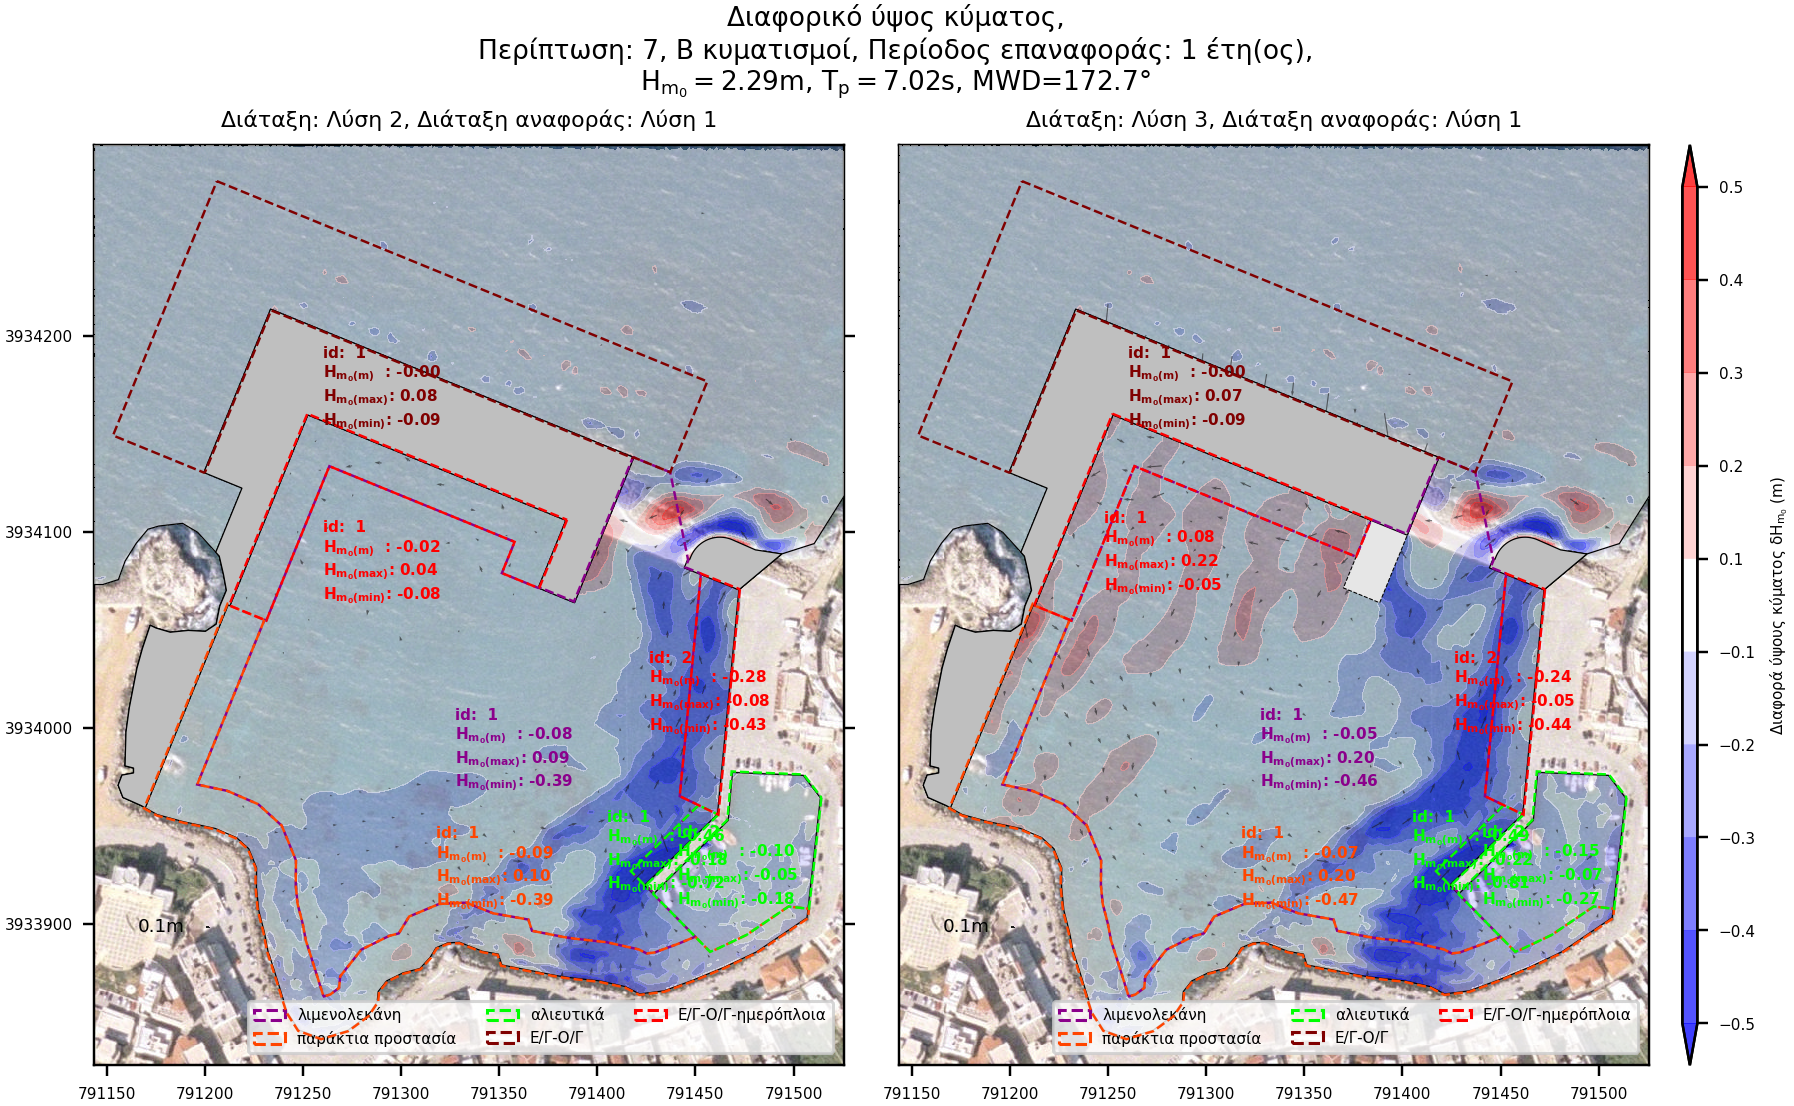
The differential disturbance diagrams results from the algebraic subtraction of the wave disturbance between the compared layouts. Therefore the "Reference Layout" disturbance is subtracted from the disturbance of the solution under consideration. A positive differential disturbance (red gradient) is resulting when the layout under consideration causes more disturbance than the reference layout. Conversely, a negative differential disturbance (blue gradient) is resulting when the layout under consideration causes less disturbance than the reference layout.
This easily identifies the positions as well as the extent to which each layout has an advantage or a disadvantage over the "Reference layout". Following is an example for the above:
Case 1: Differential wave disturbance with respect to the existing conditions.
Case 2: Differential wave disturbance of the two alternatives layouts (alternatives 2 and 3) with respect to the layout originally proposed (alternative 1)
Qualitative analysis
Rating is calculated using an evaluation model that takes into account the following wave disturbance parameters for each zone:
- Active wave height (Hm0(rms)),
- Maximum wave height (Hm0(max)),
- Wave height exceeding predefined limits of allowable disturbance (Hm0(exc)),
- Zonal percentage area exceeding predefined limits of allowable disturbance (PAexc).
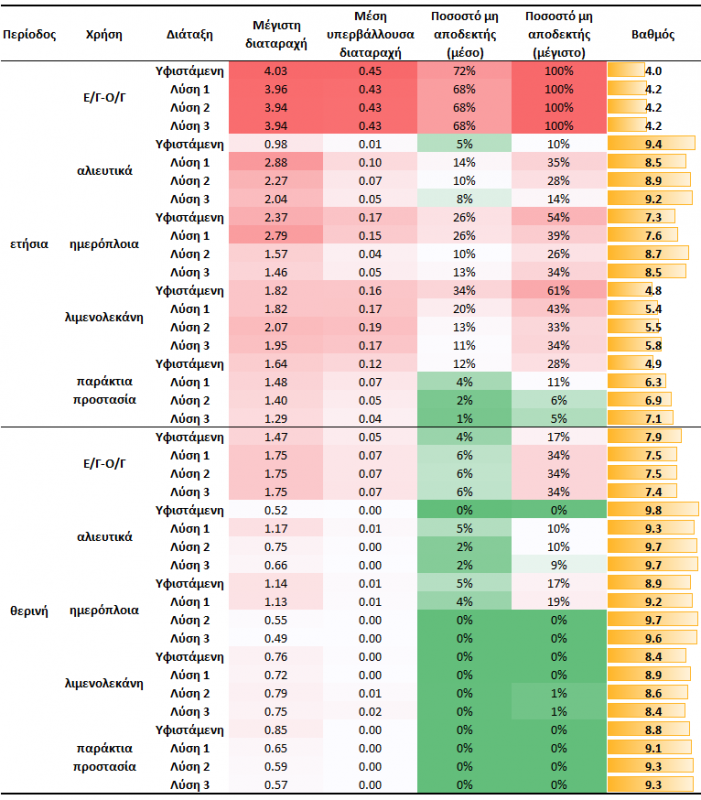
The above table summarizes the parameters calculated (averages of all wave cases per period) for each zone indicated in the disturbance plots, as well as the individual rating obtained. Thus, the effectiveness of each solution can be systematically evaluated, individually for each parameter and overall as well.
Of course, the evaluation methodology and the individual weighting factors that influence the overall score are adjusted according to the particular conditions and use priorities of each port.
References
[1] Kallos, G., 1997: The Regional weather forecasting system SKIRON. Proceedings of the Symposium on Regional Weather Prediction on Parallel Computer Environments, 15-17 October 1997, Athens, Greece. Pp 9.